Stage one and two
Designing and testing
The strategy builder and the backtest engine. This is where an idea becomes something precise enough to be wrong.
The indicator registry
A hundred and thirteen indicators are declared in a single registry, and everything downstream reads from that one place: the builder's dropdown, the engine that computes the series, the mining grammar that assembles candidates, and the screens that rank a universe. Since Round 540 every one of them can be drawn by the search as well as chosen by hand — none is reachable only from the builder.
That is an architectural decision with a practical consequence — adding an indicator is one declaration rather than an edit in six files that must agree. The registry carries each indicator's parameters, its warm-up requirement and how it is drawn, so a new entry arrives complete.
The families
11 groups · 113 indicatorsTrend is price going somewhere, measured over a windowdirection
Moving averages of several kinds, directional strength, slope and channel position. The family everything else tends to be defined against — most "is this working" questions reduce to whether a trend measure agrees with the position.
The trap: every trend measure lags by construction. A faster one lags less and whipsaws more, and no parameter search removes that trade-off — it only moves it.
Momentum is the rate of change, not the directiondirection
Rate-of-change over a lookback, oscillators, and relative measures that compare an instrument's move to its own recent distribution.
The trap: momentum and mean reversion are the same measurement read with opposite signs. A strategy that mixes both without a regime gate is usually two strategies fighting.
Mean reversion is distance from a centredirection
Bands, z-scores against a rolling mean, and stretch measures that ask how unusual the current position is relative to recent history.
The trap: works beautifully until it does not, and the failure is unbounded. Reverting to a mean assumes a mean exists.
Volatility sizes everything elserisk
Realised volatility over several windows, true range, and ratios between fast and slow estimates that indicate whether conditions are changing.
Used less as a signal than as a denominator: position size, stop distance and regime gates are all commonly expressed in volatility units so they adapt without a parameter change.
The trap: volatility clusters. Yesterday's estimate is a good predictor of today's and a poor one of next month's.
Volume asks whether anyone was thereconfirmation
Absolute and relative volume, volume-weighted prices, and participation measures used mostly to confirm or veto a signal from another family.
The trap: volume conventions differ by provider and instrument. A rule tuned on one source can mean something different on another — which is one reason the data-source selector has no fallback.
Breadth looks across a universe, not at one instrumentcross-sectional
How many members of a universe are advancing, how many are above their own trend, and how concentrated the movement is. A market where three names carry the index behaves differently from one where everything rises.
The trap: breadth needs the whole universe loaded and aligned in time. It is the family most easily corrupted by a gap in one member's history.
Relative strength ranks members against each othercross-sectional
An instrument's performance measured against its peers rather than against zero. This is the family cross-sectional rotation is built from — the rank is the signal.
The trap: a rank computed on data that was not yet available is the easiest lookahead bug to introduce and the hardest to see, because the result simply looks good.
Regime classifies conditions rather than predicting themcontext
Labels a period as calm, stressed, trending or ranging using volatility, breadth and trend measures together. Used as a gate: a strategy can be permitted to act only in the conditions it was designed for.
The trap: a regime label is itself a model with parameters, so a strategy gated on one has more fitted parameters than it appears to.
Seasonality is calendar structurecontext
Day of week, month, position within the month, and proximity to known calendar events.
The trap: the family most likely to produce pure coincidence. With enough calendar slices something will always look significant — which is exactly what the empirical null exists to measure.
Statistical describes the distribution itselfshape
Rolling correlation, dispersion, skew, autocorrelation and distribution-shape measures. Used to characterise behaviour rather than to time entries.
Rolling regression belongs here too — slope, goodness of fit and a channel around the line — computed about the window's own mean, so a series trading at a high price level cannot destroy the precision of the fit it is measuring.
The trap: these need long windows to be stable, and a long window means a long warm-up before a strategy may honestly trade at all.
Structure is swings, pivots and the shape of the tapeshape
Swing highs and lows, higher highs and lower lows, and how many bars ago the last one printed. A pivot cannot be known at the bar that makes it — it needs the bars after it to confirm it — so every structure measure publishes a pivot on the bar that confirms it, while its age still counts from where it actually printed.
The trap: the popular implementations mark the pivot on the bar that made it, which reads the future by exactly the confirmation window and produces some of the most convincing backtests there are.
Indicators you write yourself
Custom indicators are written as formulas — expressions over price, volume and other indicators — and evaluated in a sandbox that parses the formula rather than executing it as code. There is no path by which a formula can reach the filesystem, the network, or anything else in the process.
- They register into the same registry as the built-ins. A formula you invented appears in the same dropdowns, computes through the same series machinery, can be mined over, and can be gated on — with a single branch in the code rather than a parallel path. There is no second-class citizenship for your own work.
- They are saved with your strategies, by reference. A strategy that uses one records which one, so the meaning of the strategy cannot drift if you later build something similar.

Strategies are trees, not scripts
An entry is a set of conditions, grouped, combined with AND and OR, and optionally gated on a regime. Same for the exit. Each condition compares something to something — an indicator to a level, an indicator to another indicator, a value to its own history.
A vocabulary for what a strategy can say
A comparison and an AND is enough to express a surprising amount, and not enough to express a great deal of what traders actually mean. Round 506 onward added the missing grammar — each piece off by default, so a strategy written before it existed means exactly what it always meant.
At least K of N votesgrammar
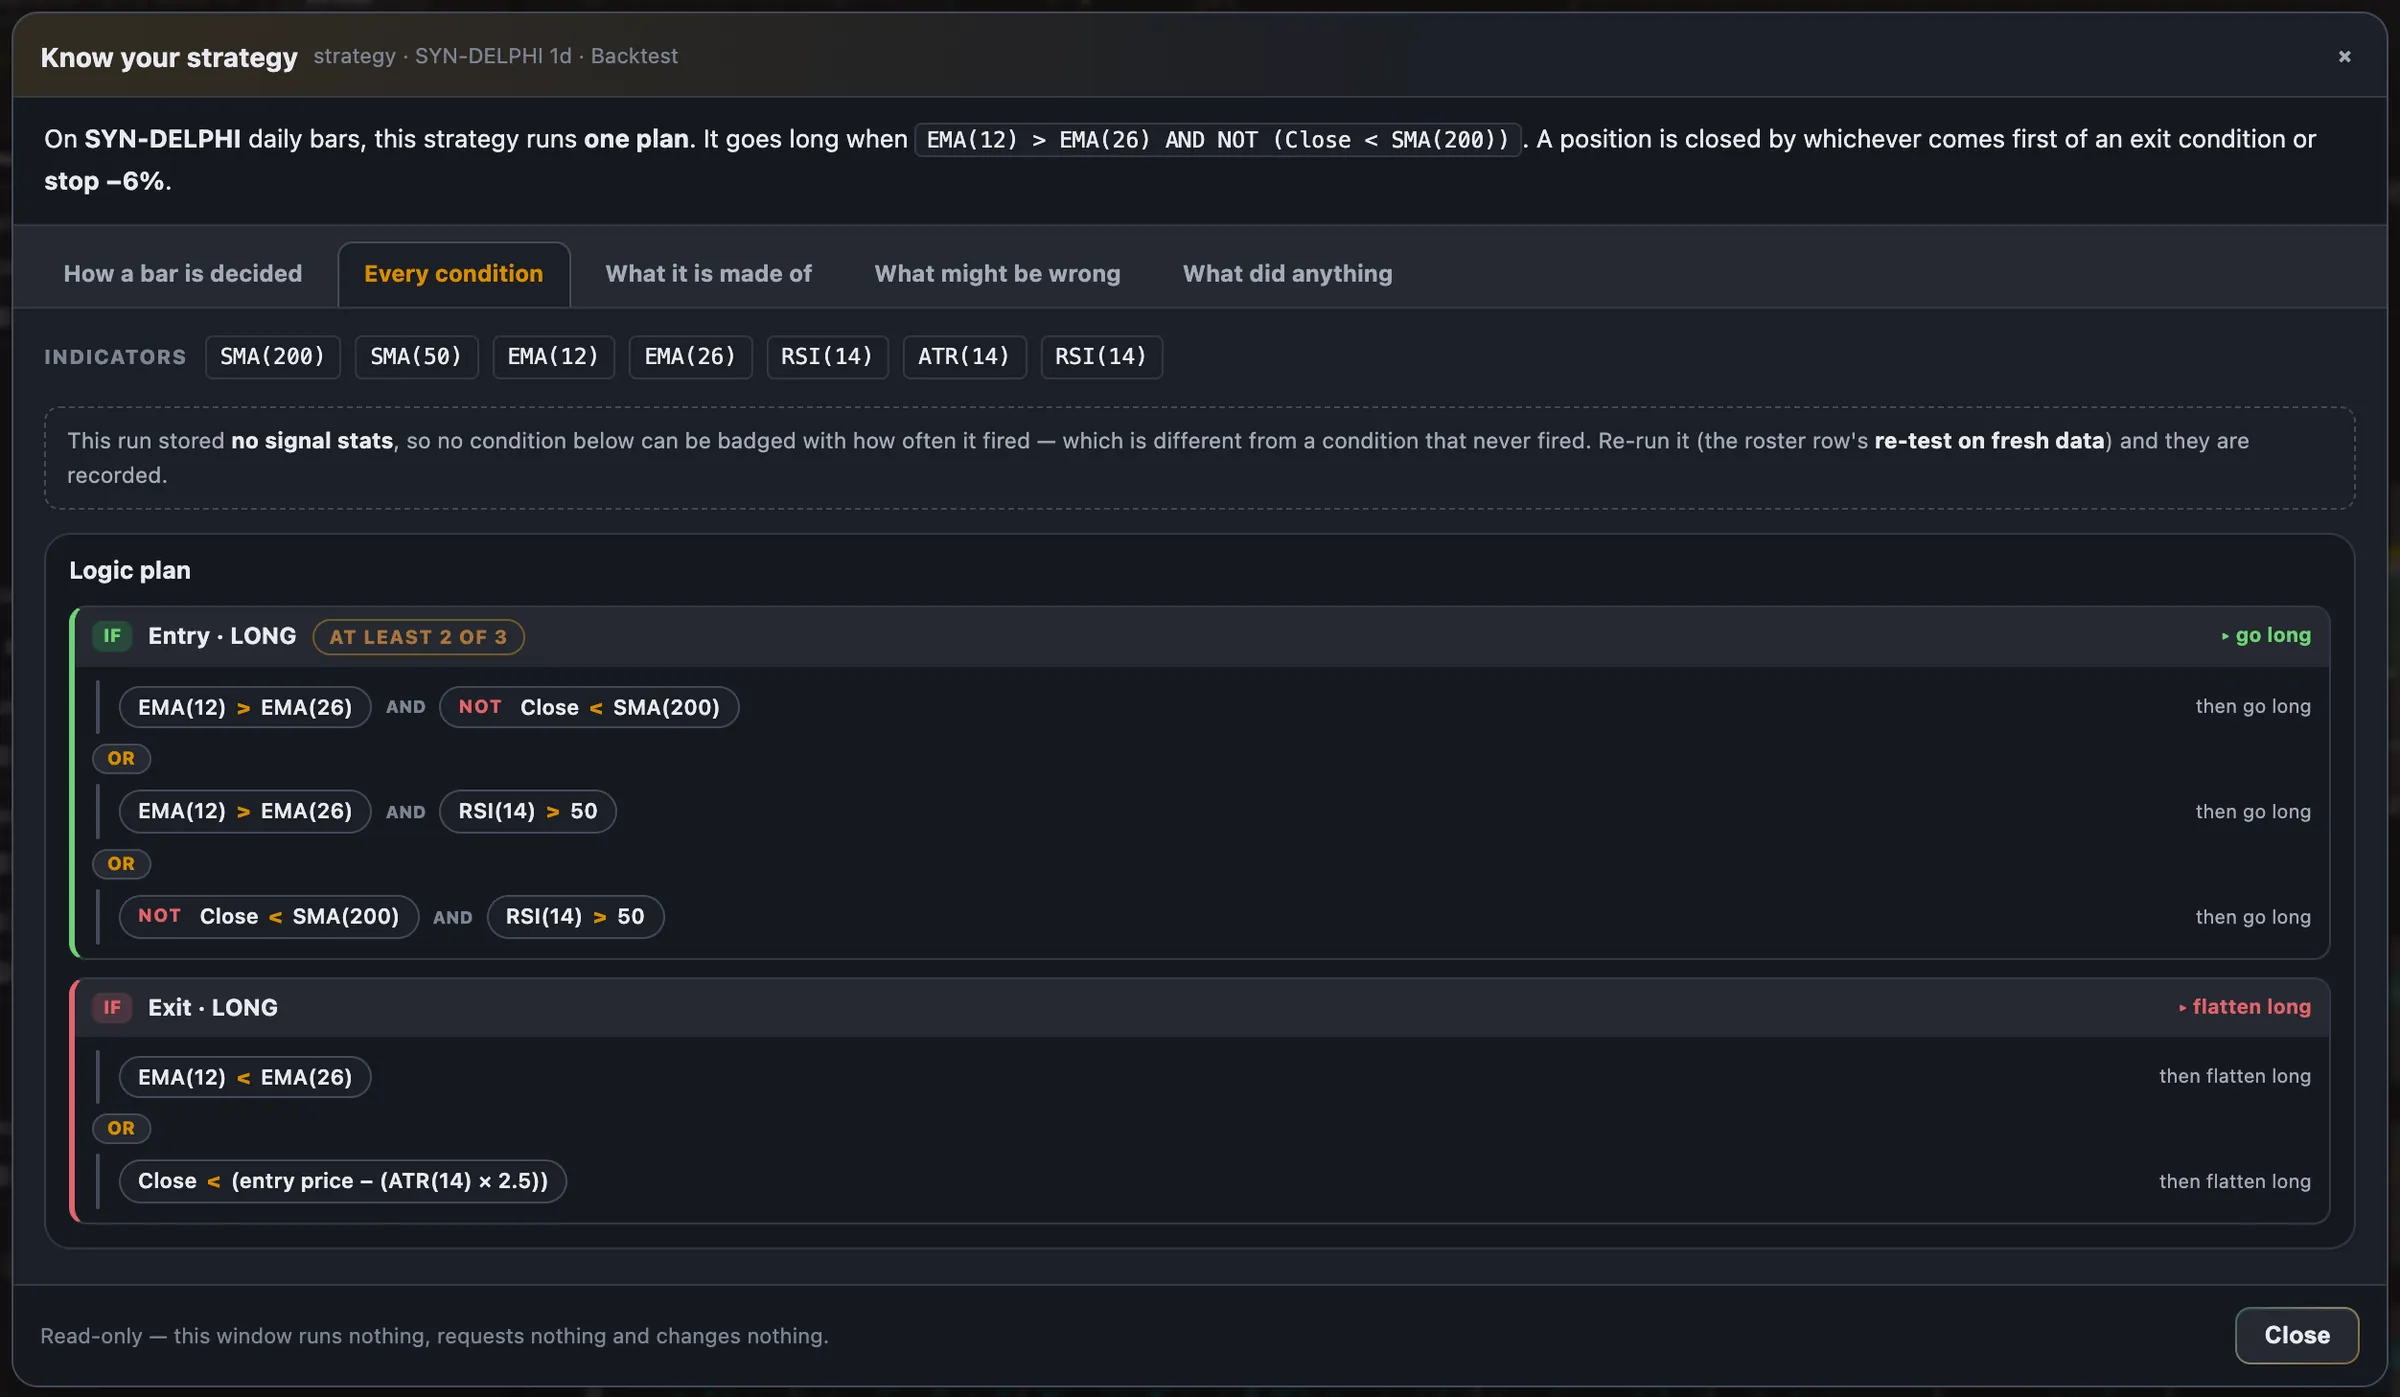
A group can fire when any two of its three conditions hold, rather than all or any. The logic tree expands a vote into the exact pairs it means, so the drawing is always the strategy the engine runs — and a group's combine mode is always stated on the group, never implied by the joins between its rows.
Guards against: a vote that, drawn as a plain list, reads as a stricter strategy than the one being run.
Weighted scores with a thresholdgrammar
Conditions carry weights and the group fires above a threshold — a scorecard rather than a checklist, drawn as the minimal combinations that clear the bar.
NOT, applied before the missing-data maskgrammar
Any condition can be negated. The negation is applied before the engine masks out bars it cannot evaluate, on the backtest path and the live path alike, so an input that is missing — a warm-up bar, an absent peer, an untrained model — never reads as true merely because it was negated.
Guards against: a dead operand quietly firing on every bar the moment someone puts NOT in front of it.
Lags and "how long ago"grammar
An operand can read its value N bars ago, and a condition can ask how many bars have passed since something last held — the cool-off, the "only after a quiet week" that traders reach for constantly.
A calendar and a clock, and what they refuse to answergrammar
Day of week, month, position in the month, minutes from the session's open. On a daily bar there is no time of day, so the clock answers unknown rather than zero — a condition on it never fires on a daily tape rather than firing on every bar.
An indicator on another symbolgrammar
The RSI of a second instrument can be an operand in the first one's strategy — the classic "only trade this when that is calm". When the second series is stale or missing at a bar, the condition cannot be evaluated, and a live deployment holds its orders rather than trading on an input it does not have.
Adding to a position, sizing by risk, reversingexecution
A strategy may add to a winning position up to a stated limit; the entry price every stop and target reads becomes the size-weighted average, and the position's age does not reset — a pyramid that restarted the clock could keep a losing trade alive by adding to it. Size can be set from the stop's distance instead of a flat fraction, and a signal in the opposite direction can reverse the position in one step.
Guards against: three execution facts the engine used to leave implicit — each a run setting now, stated, and off unless chosen.
The append-invariance gate asks the whole registryproof
Every indicator and every operand is computed twice — over a prefix of the tape, and over all of it — and every bar the two share must be identical. A value that changes when later bars arrive was reading them. The gate covers whole engine runs too: a trade booked on a prefix must survive the arrival of the rest.
Guards against: the lookahead bug, in the one form that can be checked mechanically for every indicator at once.

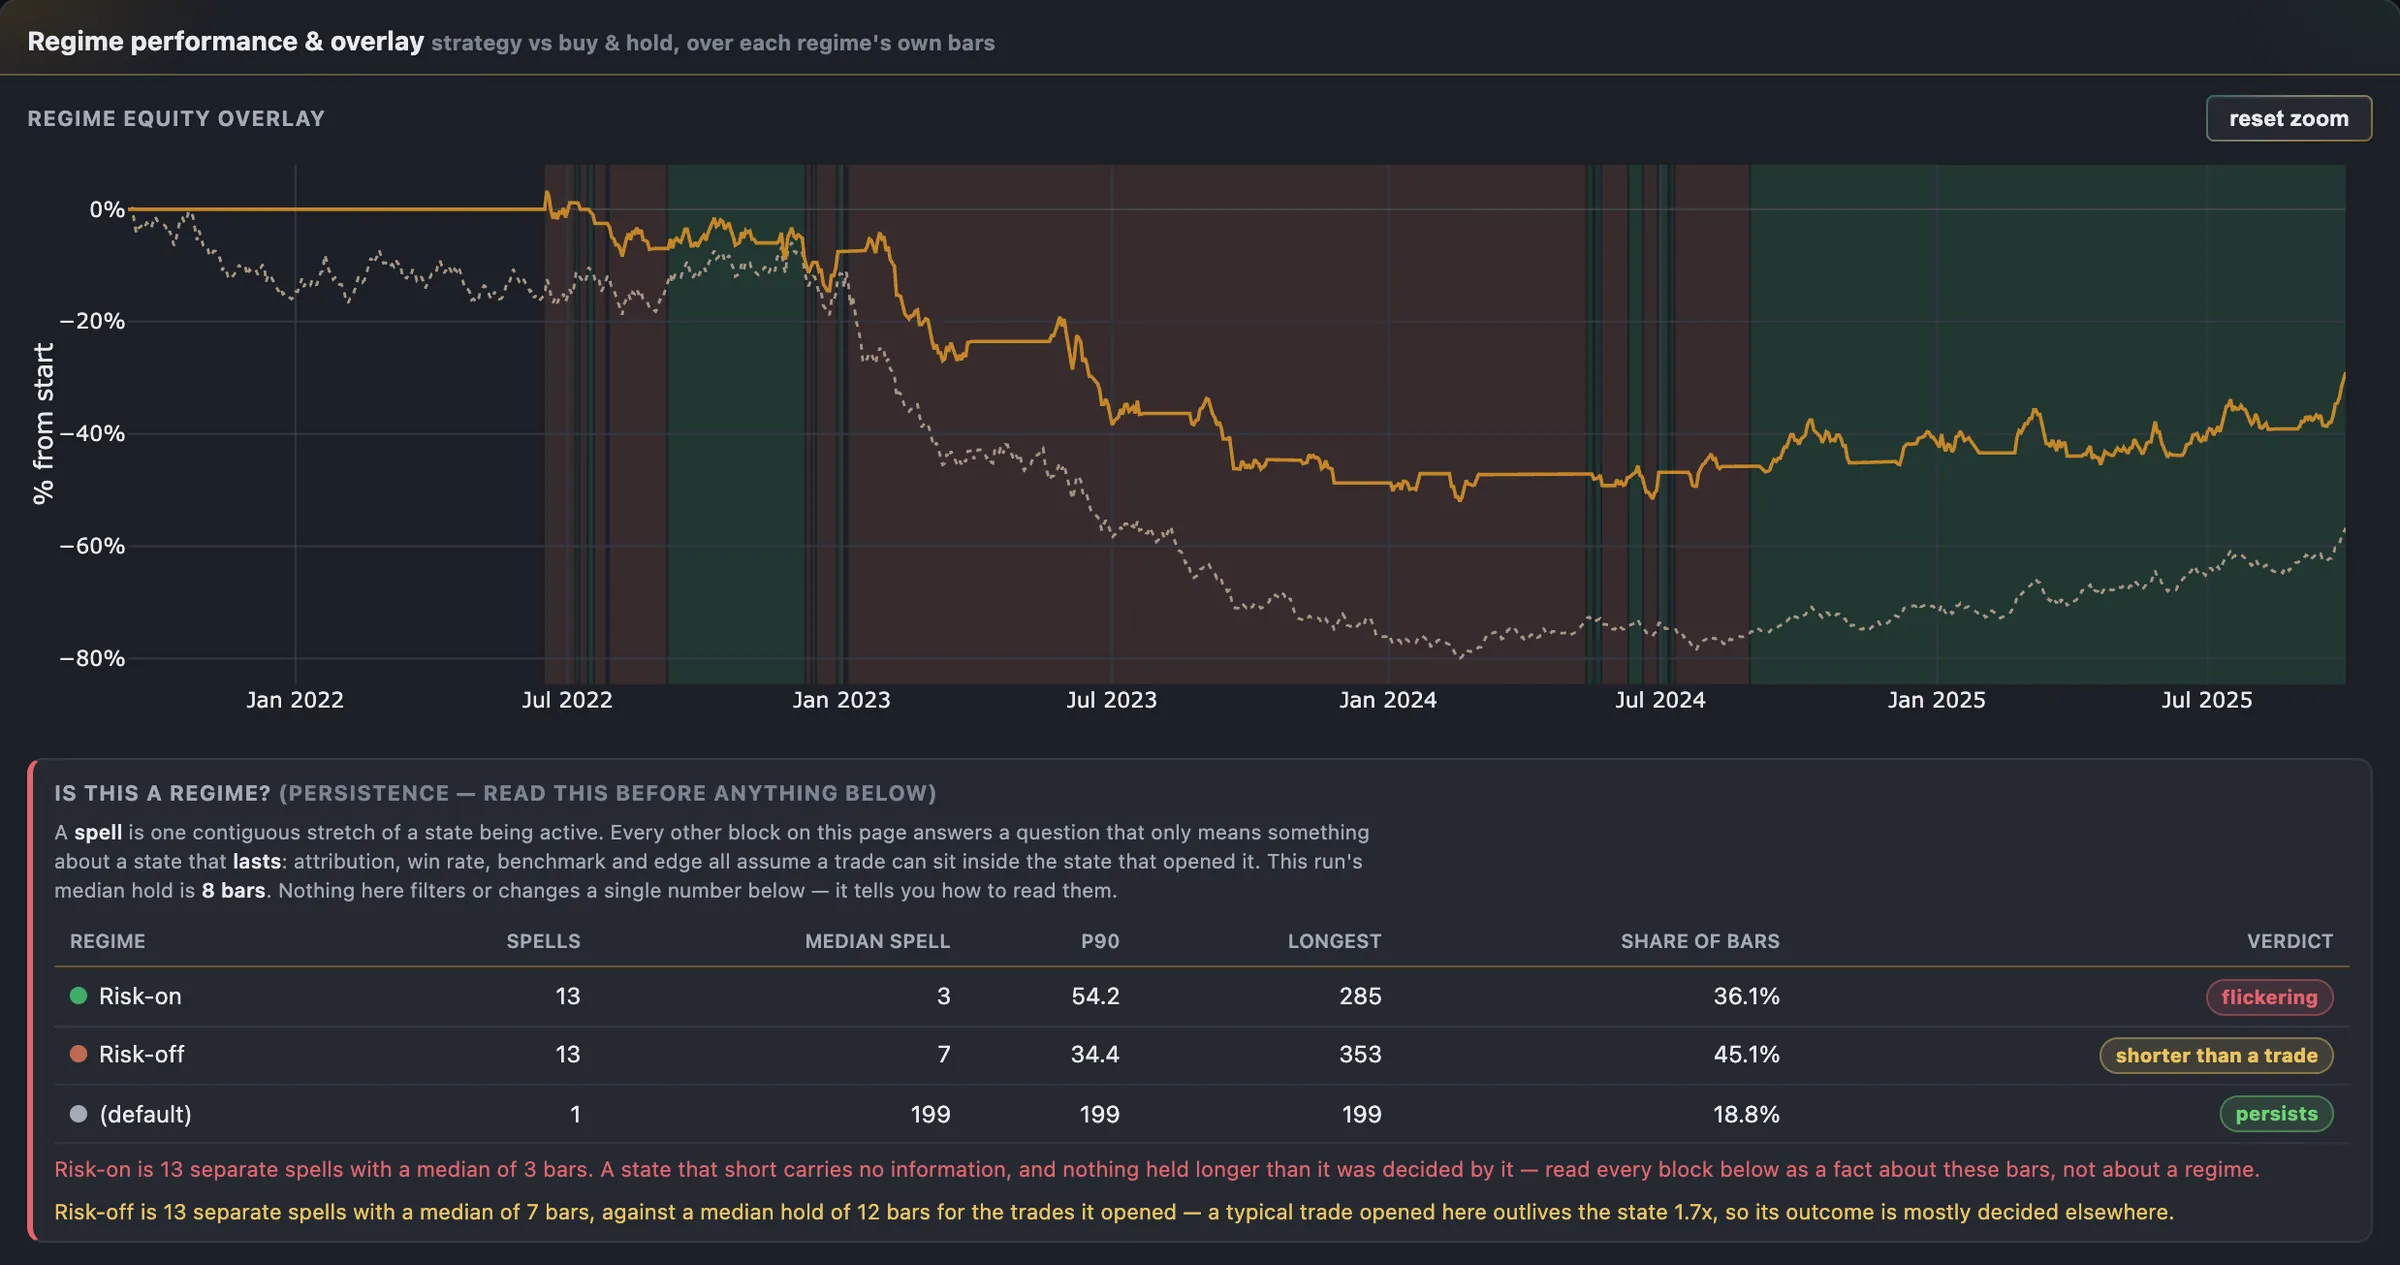
Because the tree is data, it can be inspected after the fact. The logic view shows which conditions actually fired, how often each one contributed, and which were effectively dead weight — a condition present in every trade is not doing any work, and one that never fires is not either.
Know your strategy
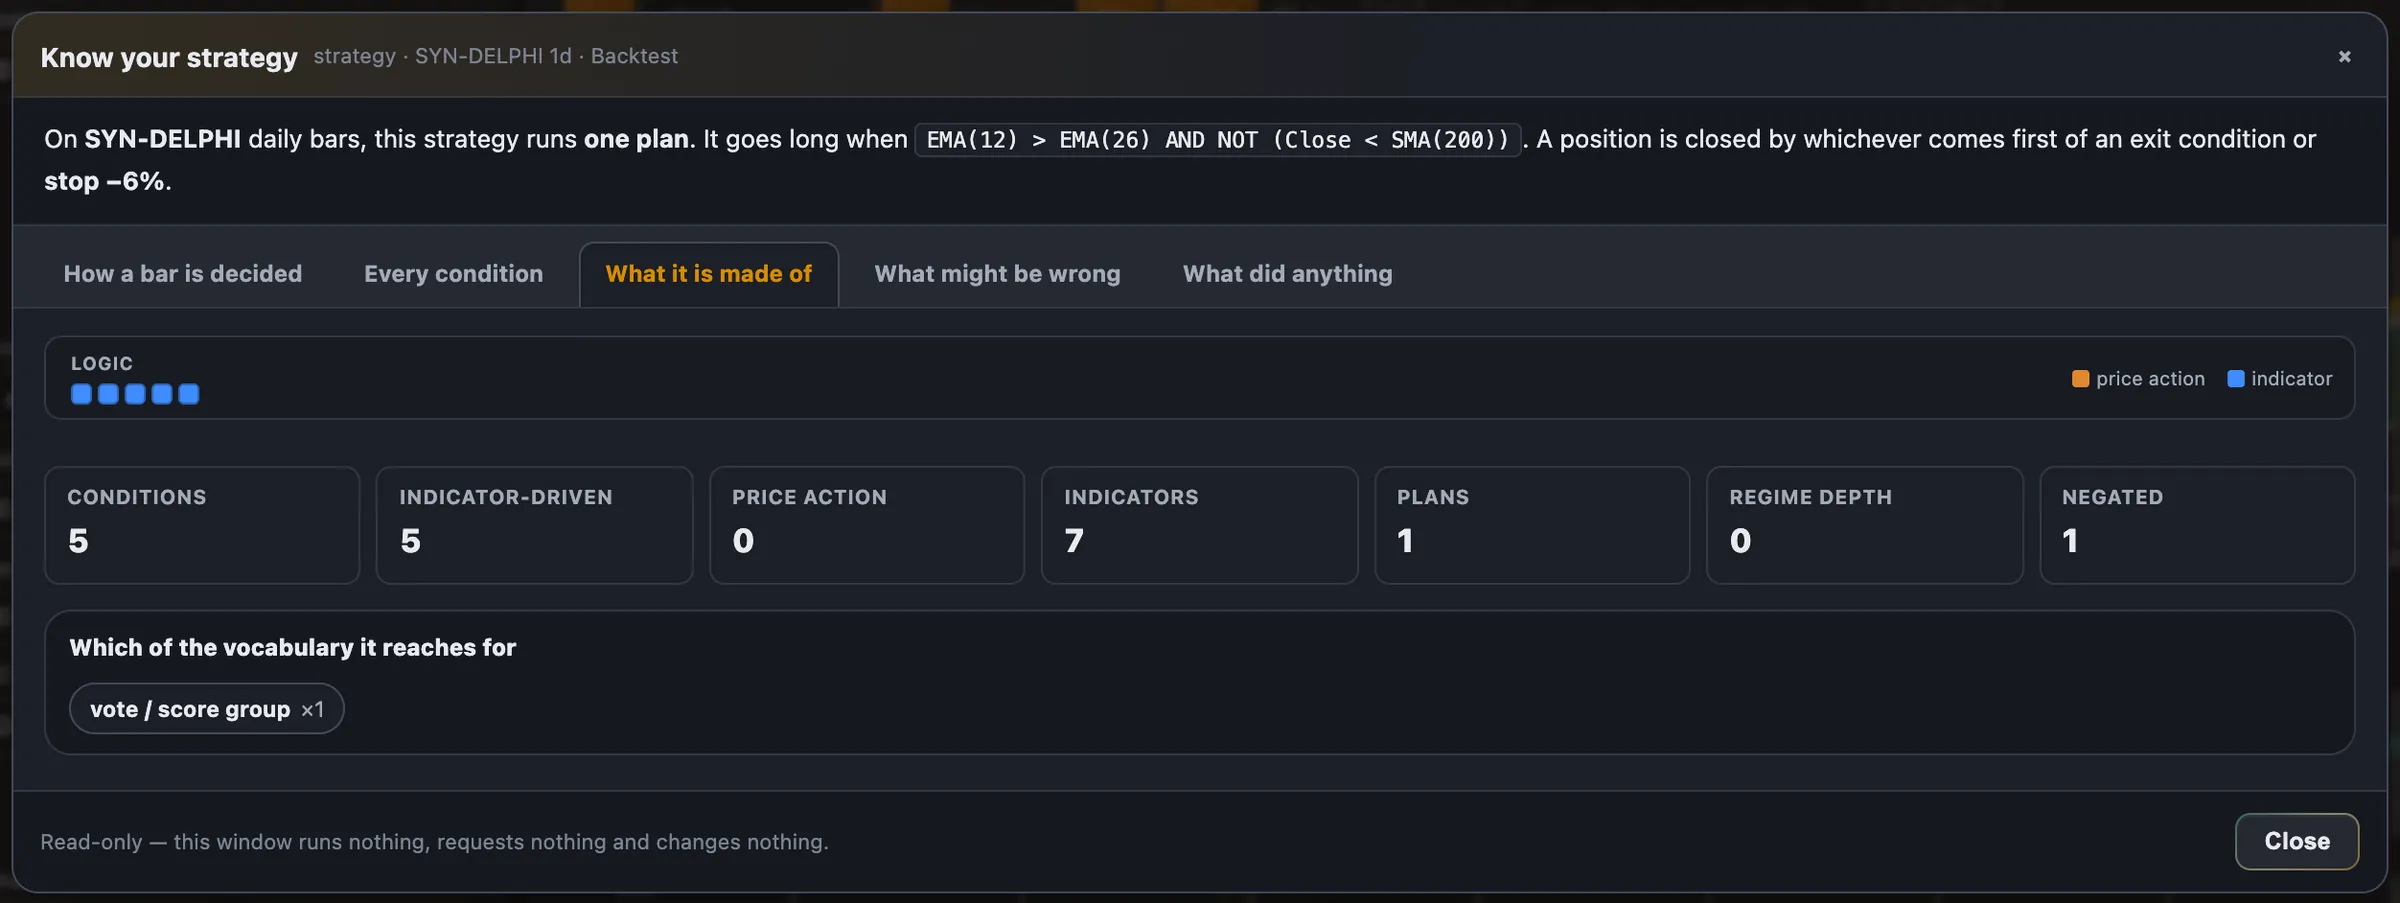
The application used to draw a strategy five different ways in five places, and the list of saved strategies had the poorest of them: a median plan of eighteen conditions across four regimes shown as six flat lines of code. A window now renders the whole plan as a tree, with how often each condition fired beside it — and it opens not on the conditions but on what can end a trade.
That ordering is the point. Stops, trails, take-profits and time limits all close a position with no condition true, and no logic tree in the application had ever mentioned them. When the window was first pointed at the saved strategies, more than half had no stop of any kind, a few could only ever be closed by a reversal, and a handful could never trade at all. It says so, in a sentence, first.

Highlighted logic
Individual conditions can be starred and annotated. The note travels with the condition's location inside its strategy and the text that makes it recognisable elsewhere, so an observation made while looking at one strategy is still findable when the same idea turns up inside another. It is the one place in the application where the content is your reasoning rather than a derived number.
What a backtest returns
Not a score. The full result: every trade with its entry and the reason it ended, the equity curve at full resolution, the drawdown profile, the statistics, and the attribution of which conditions fired when — drawn as the book, the same component the Replay page uses for a running deployment. A backtest can be played, scrubbed bar by bar, jumped from signal to signal and looped, with a panel beside it saying which of the strategy's conditions were true under the cursor. Clicking a trade in the trades table moves the book to it.
| Modelled | Why it is not optional |
|---|---|
| Commission and fees | A strategy that trades often can be profitable gross and losing net. Trading frequency is a cost decision, not just a signal decision. |
| Slippage | You do not get the price you saw. Sweeping slippage rather than assuming one value shows how much of a result depends on filling well. |
| Execution delay | A signal computed on a close cannot be filled at that close. Lag is charged deliberately rather than being an accident of the data. |
| Warm-up | An indicator needs history before its first honest value. Trading during warm-up invents signal out of an incomplete window. |
| Non-trading gaps | Weekends and holidays are collapsed rather than drawn as flat lines, so a chart does not imply activity where there was none. |
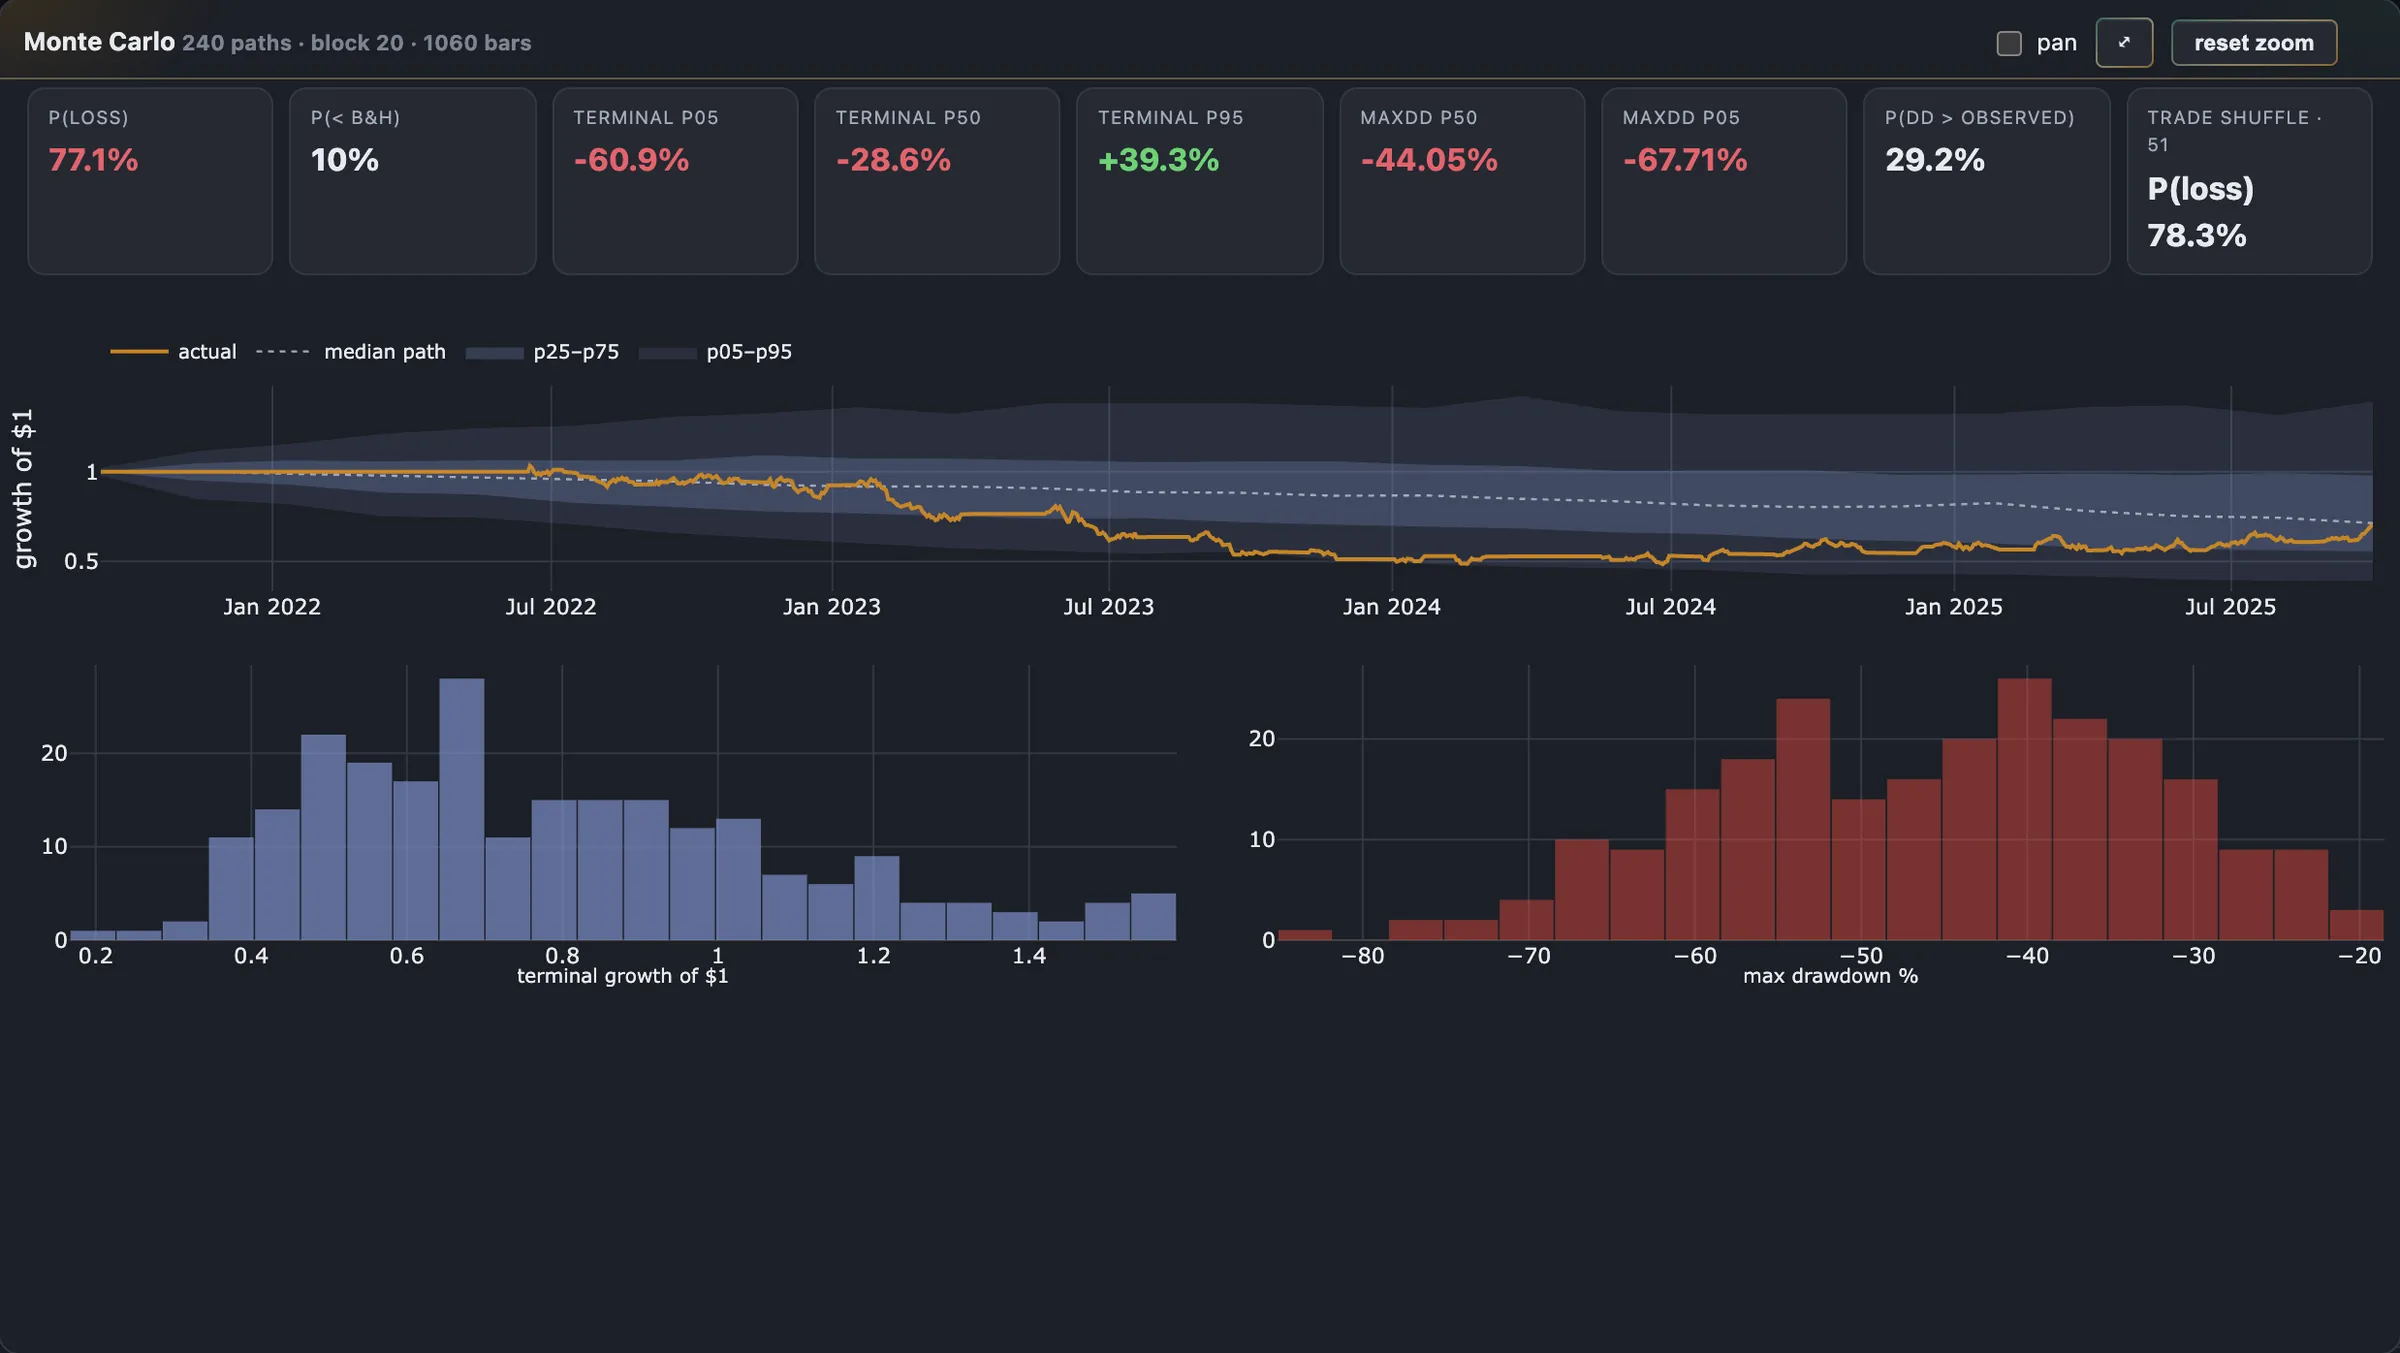
Charts that do not flatter
- Linked zoom across figures, so a drawdown and the price that caused it stay aligned while you look.
- Currency and percentage views of the same series, because a curve that looks dramatic in one is often unremarkable in the other.
- A buy-and-hold baseline. A result can always be read as the difference against simply holding the same instrument for the same span, so a rising market cannot quietly take the credit.
- Sub-panes per indicator, with the indicator drawn on the same time axis rather than a separate picture you have to align by eye.
- Gaps drawn as breaks. Missing data is shown missing. A line joined across a hole is a claim that nothing happened there — and where the axis collapses a weekend, a quiet mark on the first bar after it says how long the gap was.
- Strips that share the book's window. Drawdown, position, volume and oscillators are drawn on the same pixel window as the book above them, so a trough sits under the bar that caused it rather than a third of the width away.
- The cash line. What the capital would have earned doing nothing is drawn beside the strategy, because a strategy invested a sliver of the time can look like skill when it is mostly interest.

Nothing on this page is investment advice or a performance claim. Where a figure, a curve or a marker appears in a frame, it is the demonstration instance's own arithmetic over app-generated synthetic series, behind the application's standing hypothetical-results warning — not a result and not a track record. Trading involves risk of loss.
Stage three
Searching for strategies
Generating and evaluating enormous numbers of candidates is the easy half. Nearly everything described below exists to stop the search handing you the luckiest arrangement of noise it could find.
How candidates are generated
A grammar assembles logic trees from the indicator registry — choosing shapes, operands, comparisons, windows and regime gates from weighted draw tables. The generator's default behaviour is deliberately frozen: absent an explicitly armed option, the server takes its historical path byte for byte, so a stored search seed reproduces exactly the same population it did when it was recorded.
That discipline is what makes an old result checkable. A search you cannot re-run is an anecdote.
There are two grammars, and the second one is where the new vocabulary lives. The classic grammar is frozen byte for byte — every stored search on it still reproduces its population exactly. The extended grammar draws from every one of the 113 indicators and writes what a person can now write by hand: a condition negated on a cross, an at-least-K vote, an exit on the position's own state, a risk gate, an indicator read off another instrument. Any change to what it draws bumps a revision number that rides on every noise floor measured under it, so a floor can never be read against a search it was not measured for.
Evolution, not just enumeration
- Populations and generations. Candidates are scored, the better ones become parents, and offspring inherit and mutate their structure. Crossover combines two parents' subtrees.
- Lineages. A run can be rooted on an existing strategy so you are exploring around something specific rather than starting from nothing.
- Immigrants. Fresh random candidates are periodically injected, because a population left alone converges and stops looking.
- Cycles, for the long runs. A search left running alternates searching with pruning — the kept set is re-filtered against the stored record, survivors seed the next pass, and an extinction guard skips a prune entirely rather than let one over-strict filter wipe the population.
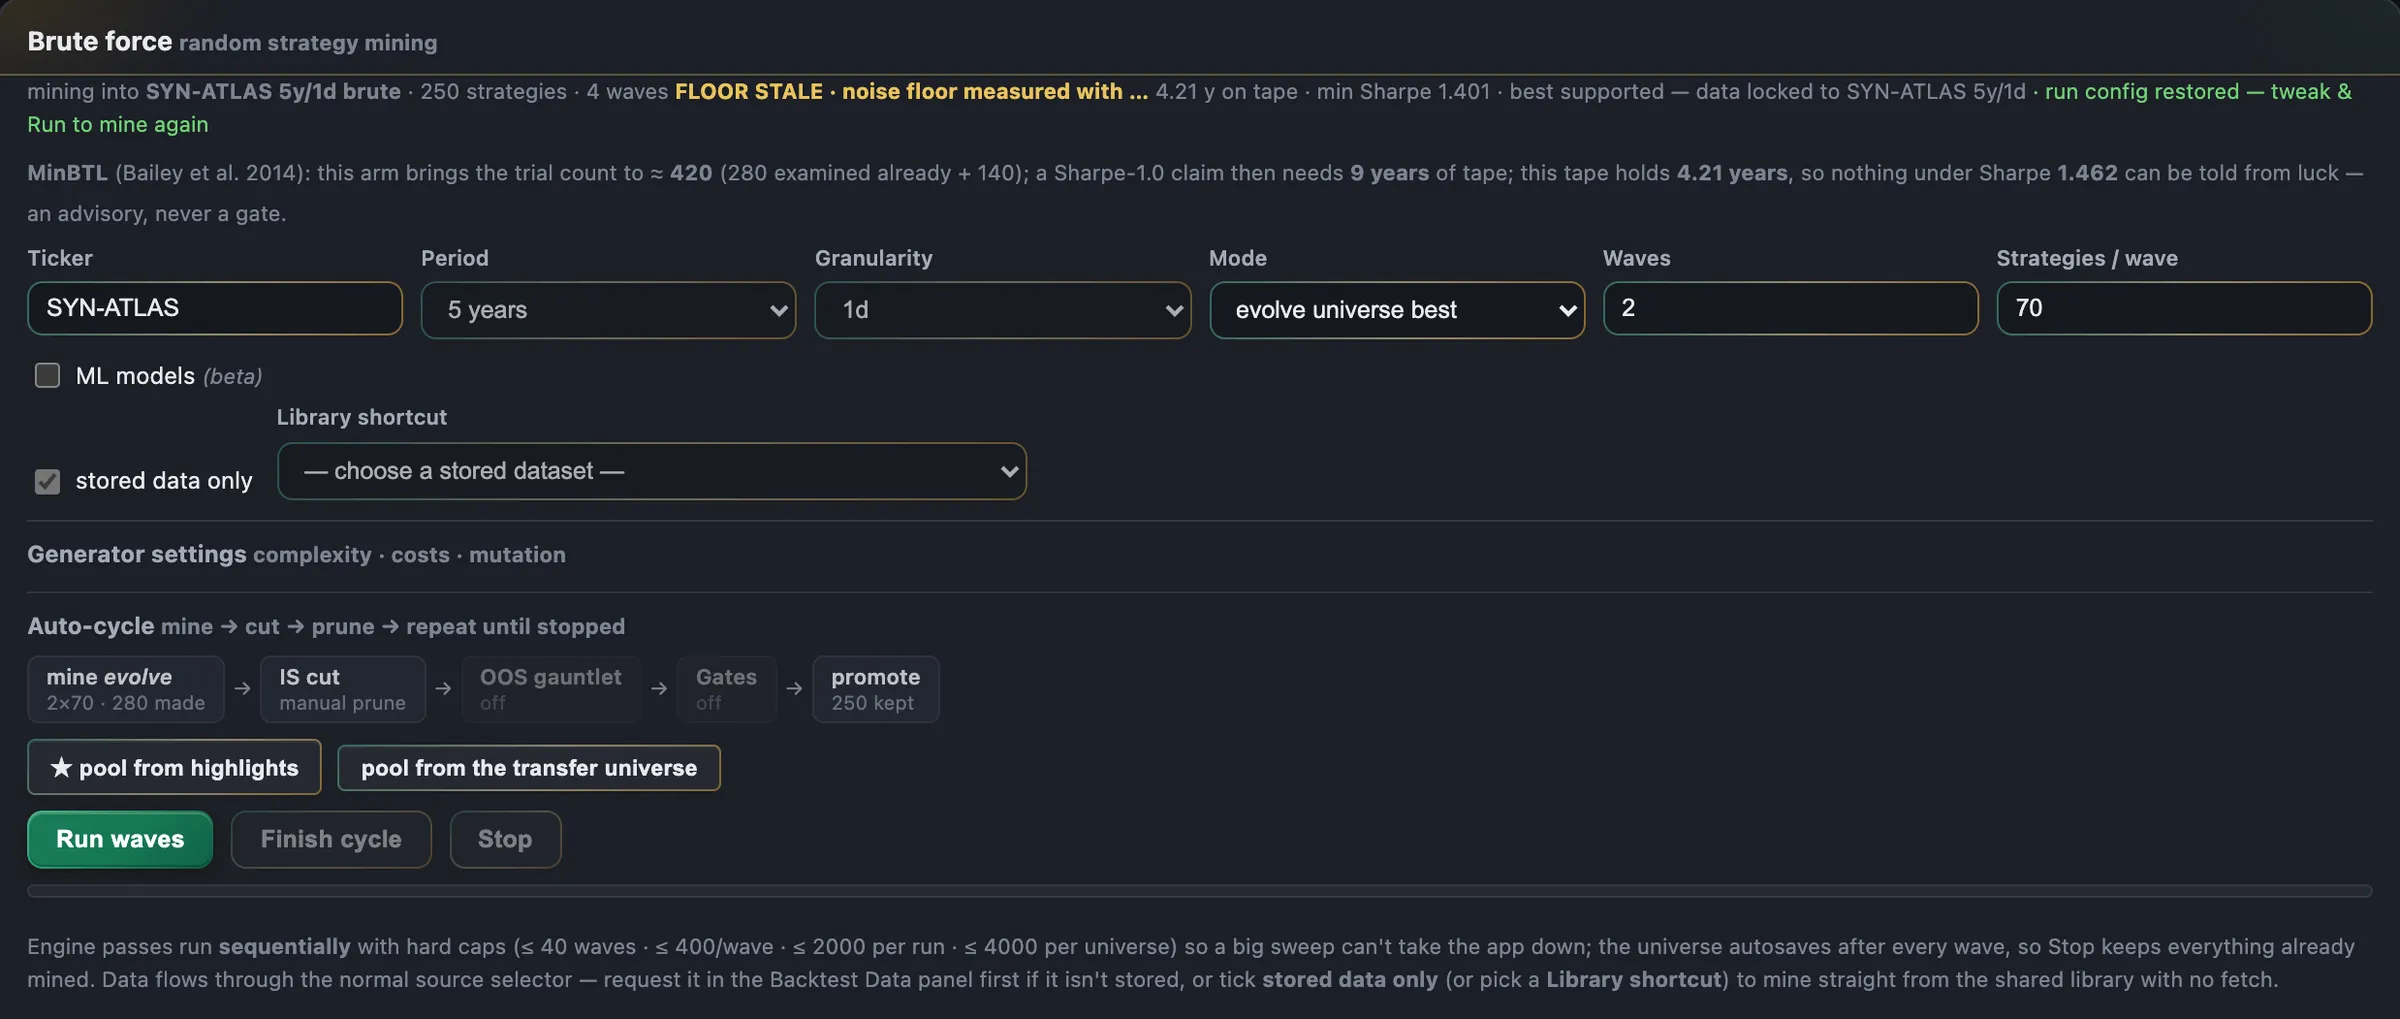
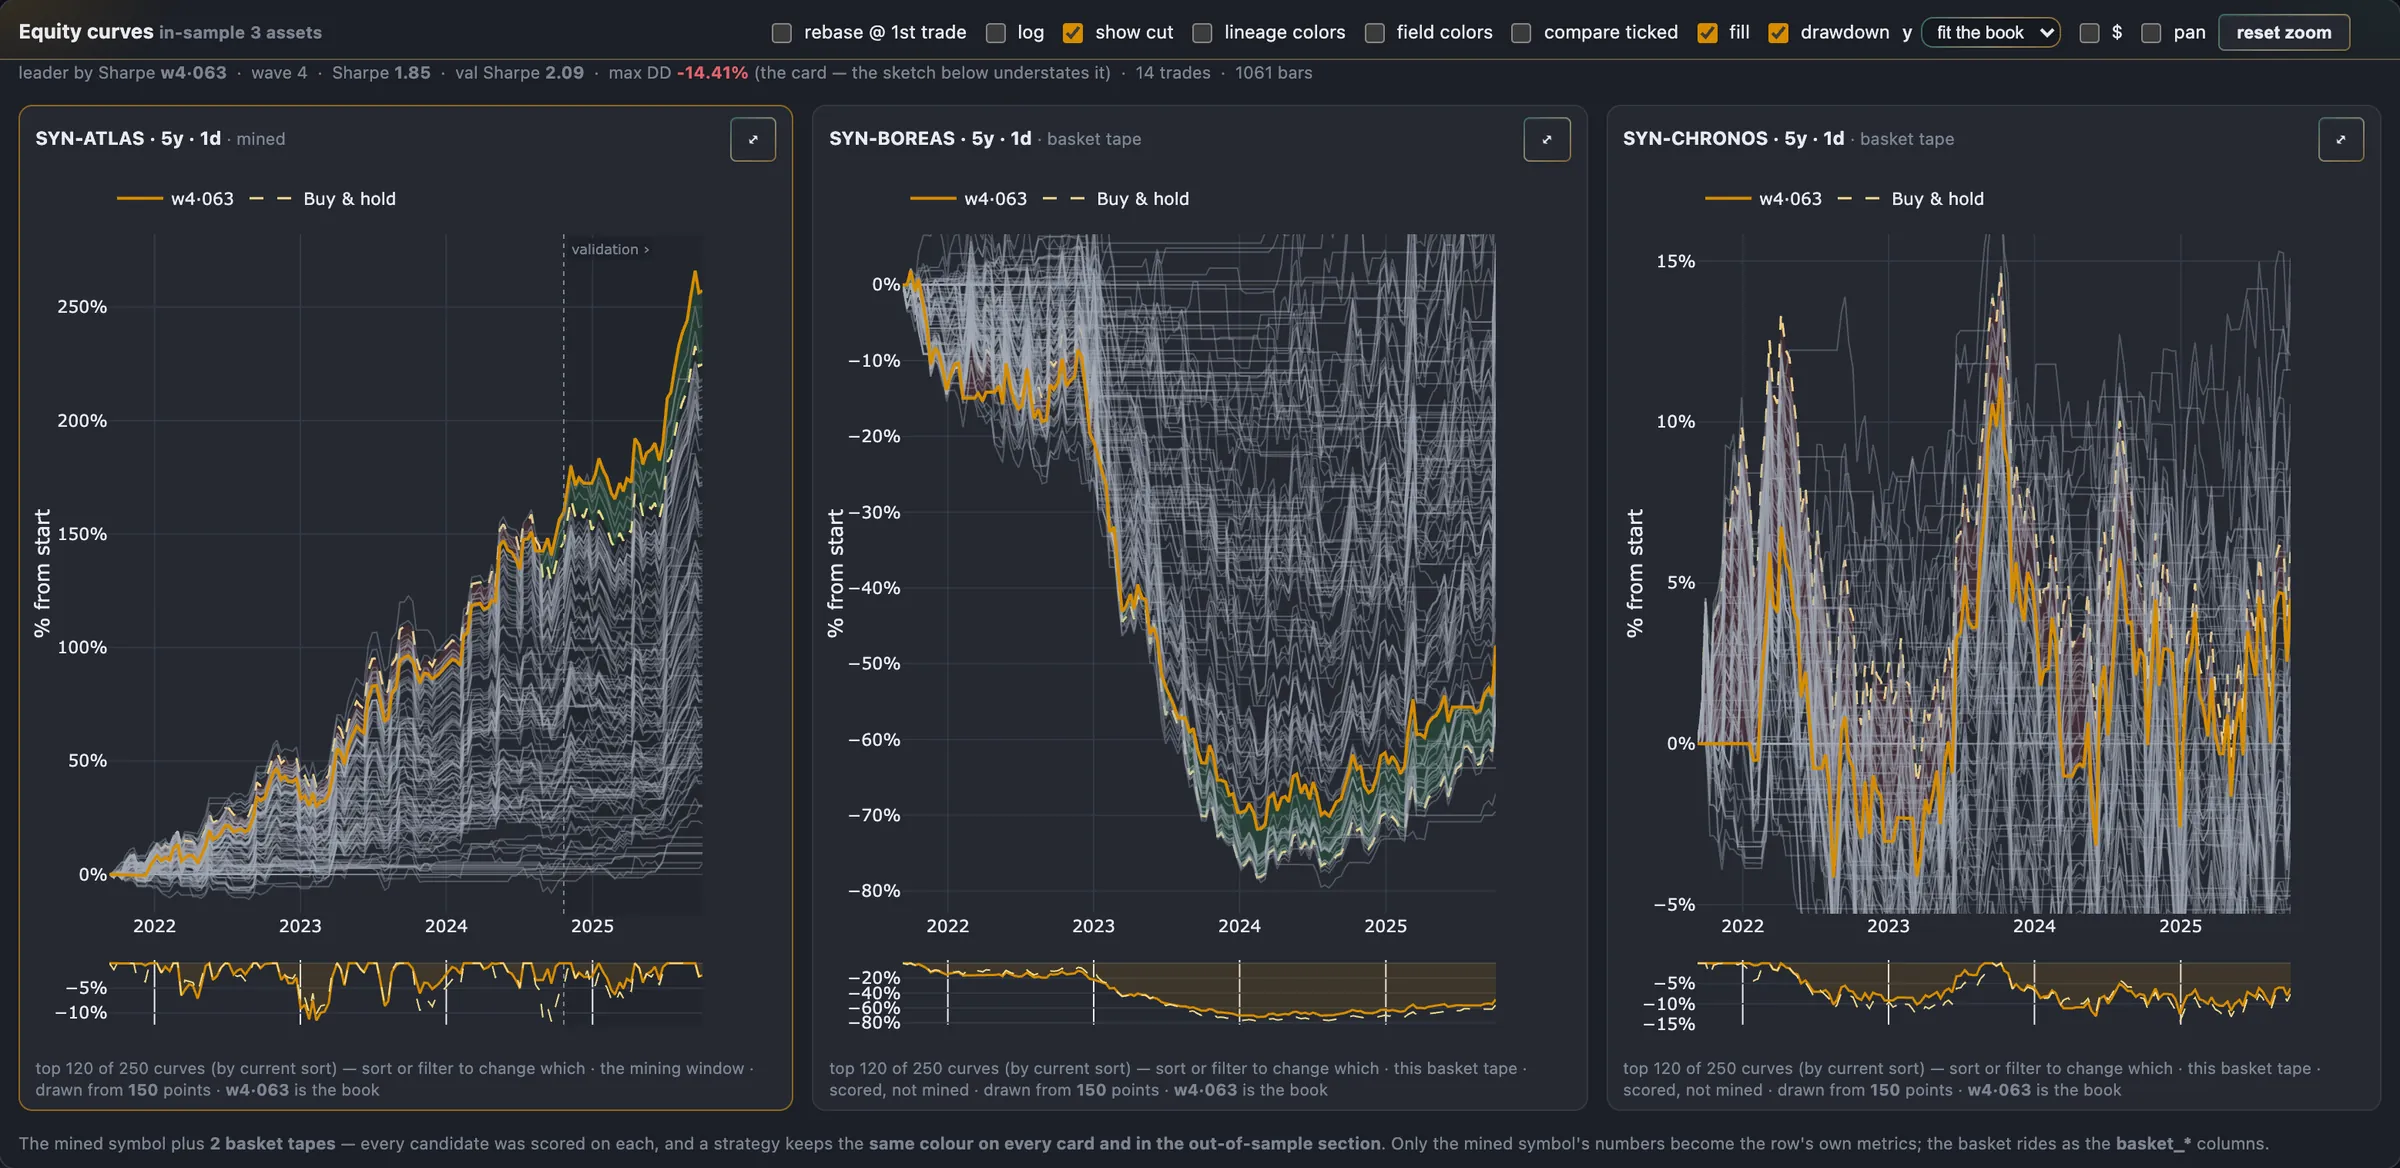
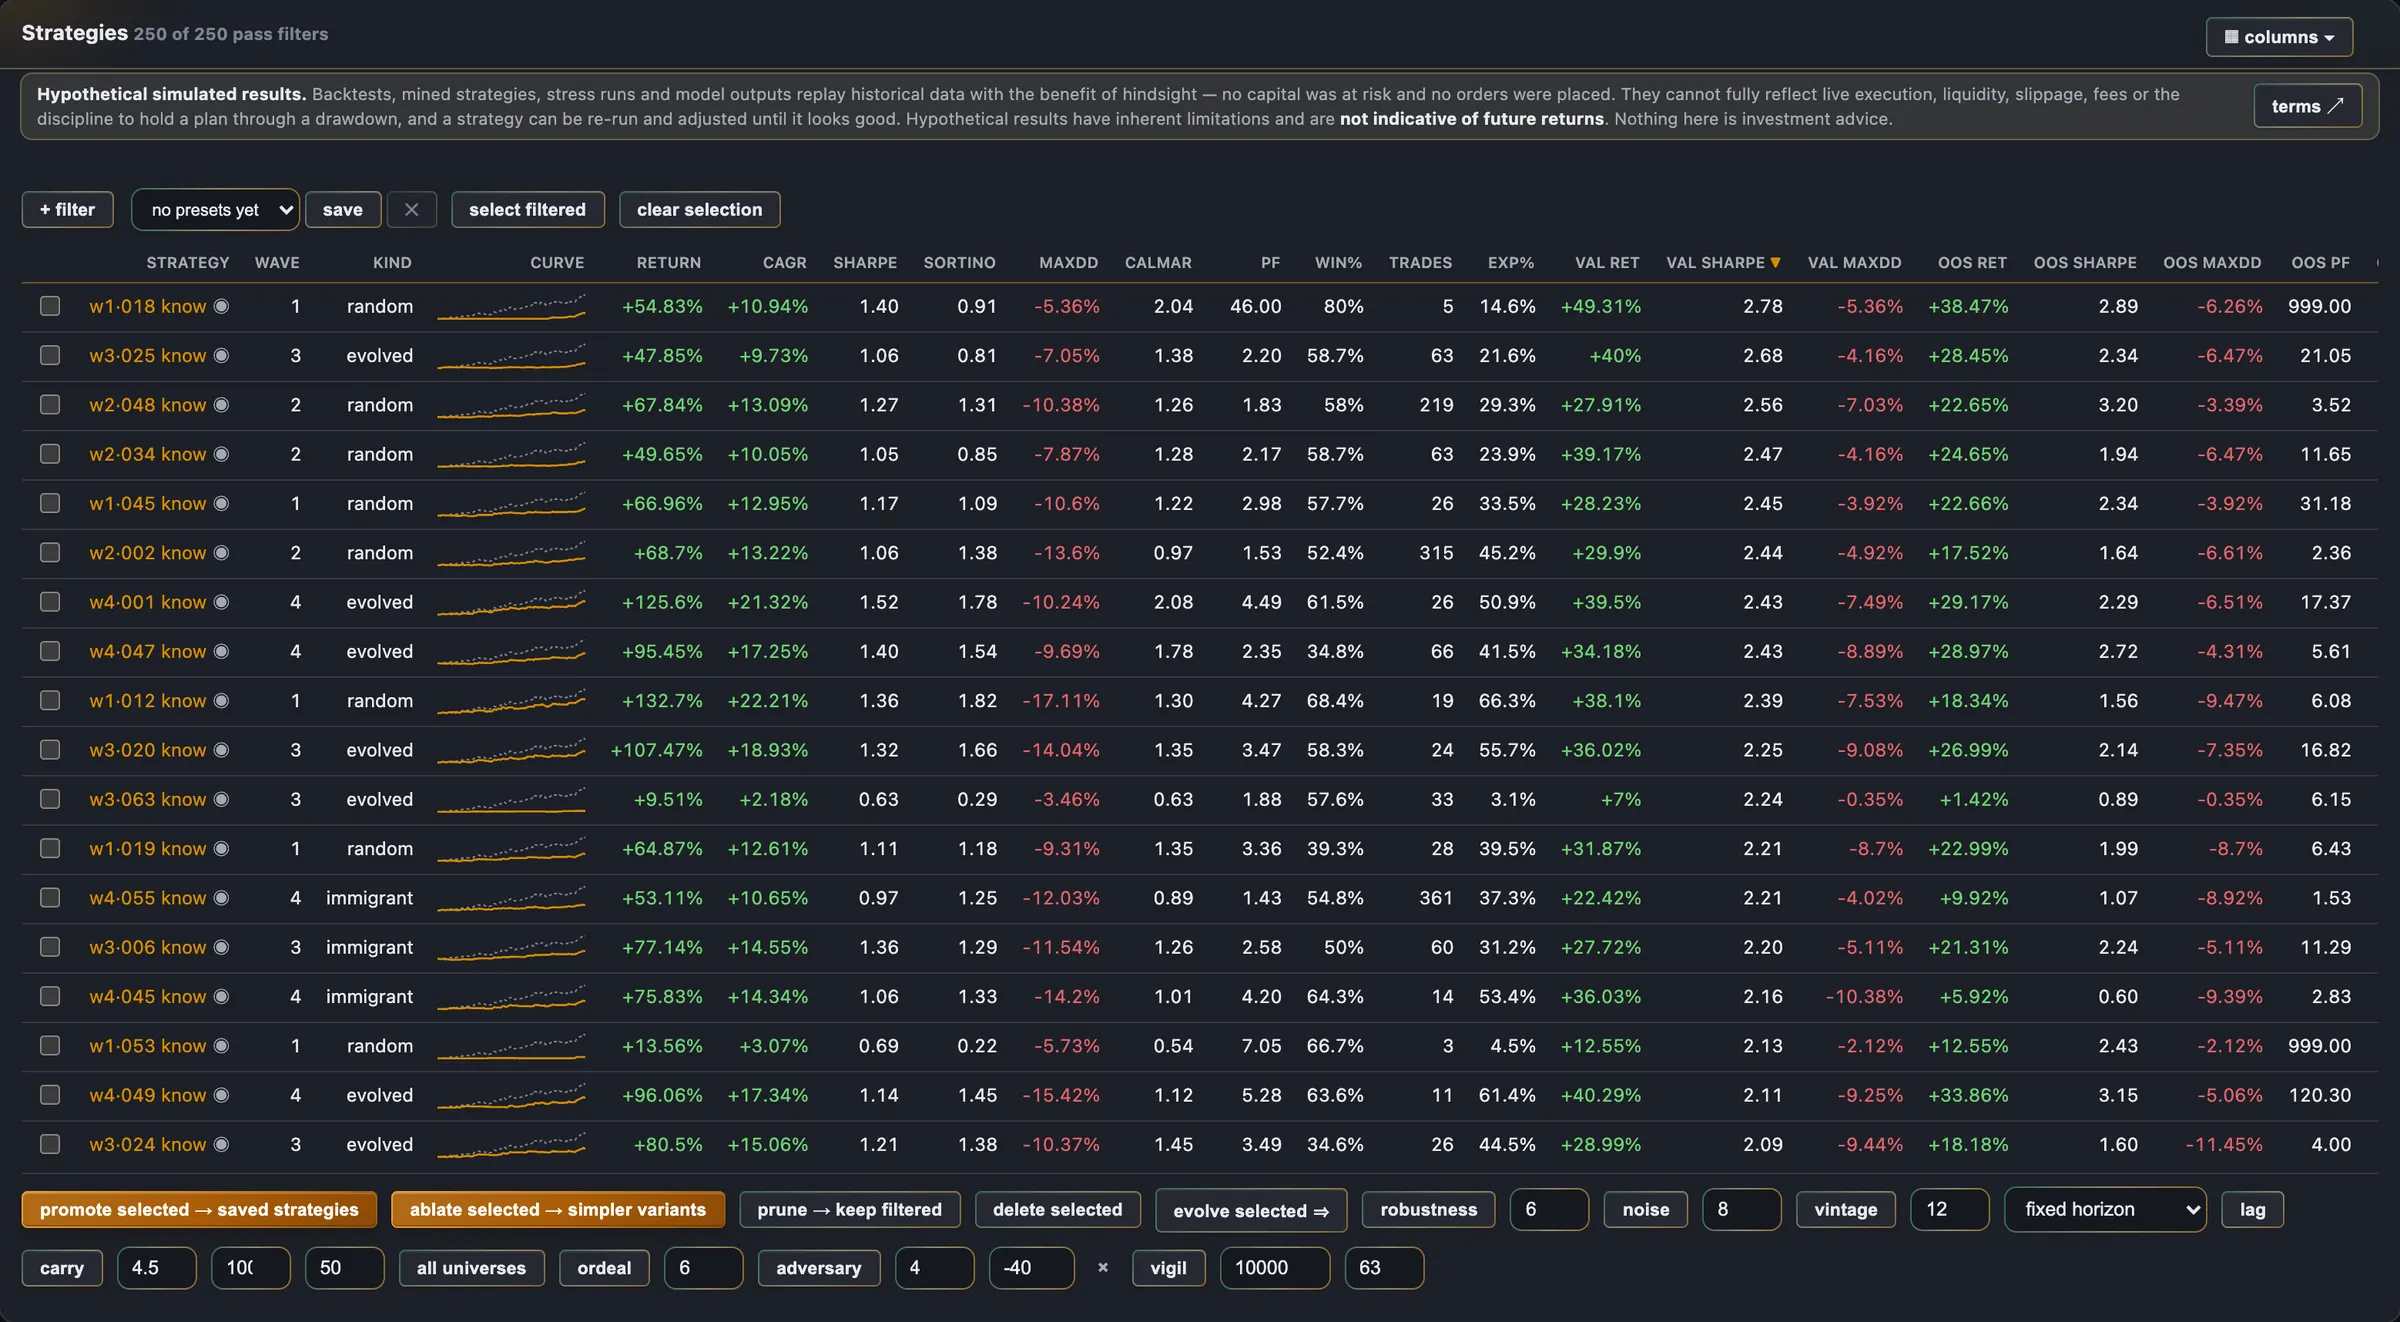
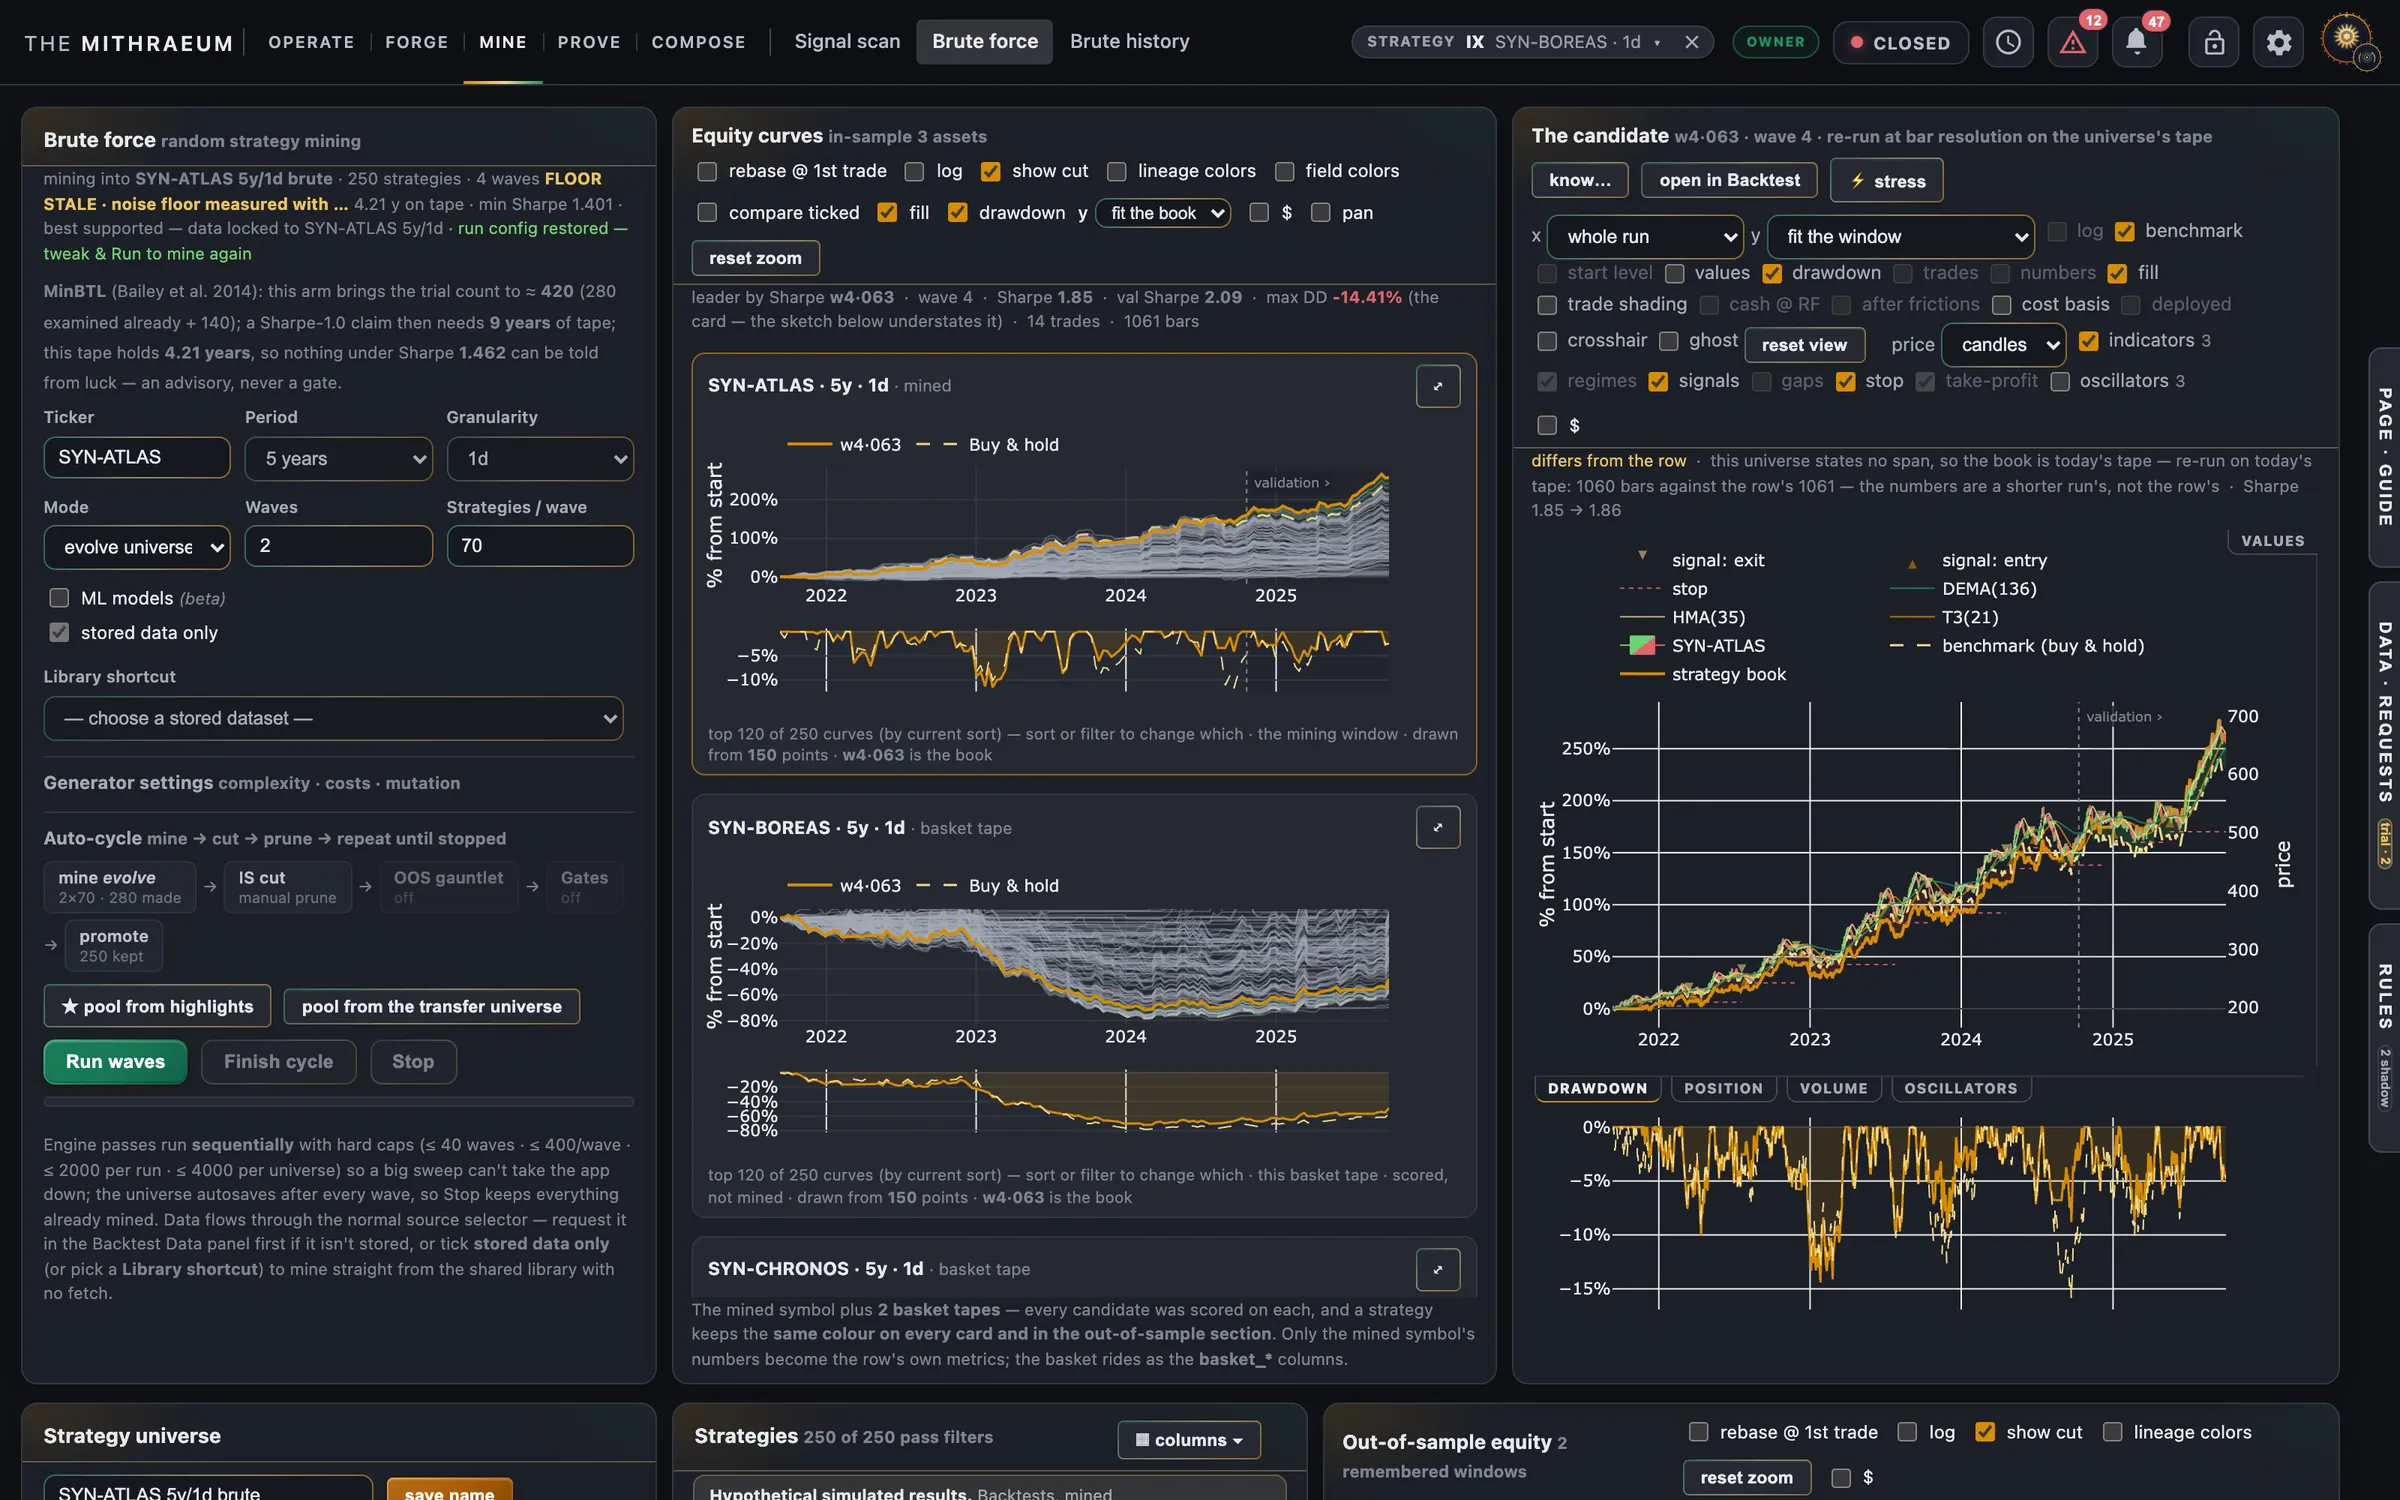
The page, and the candidate's own book
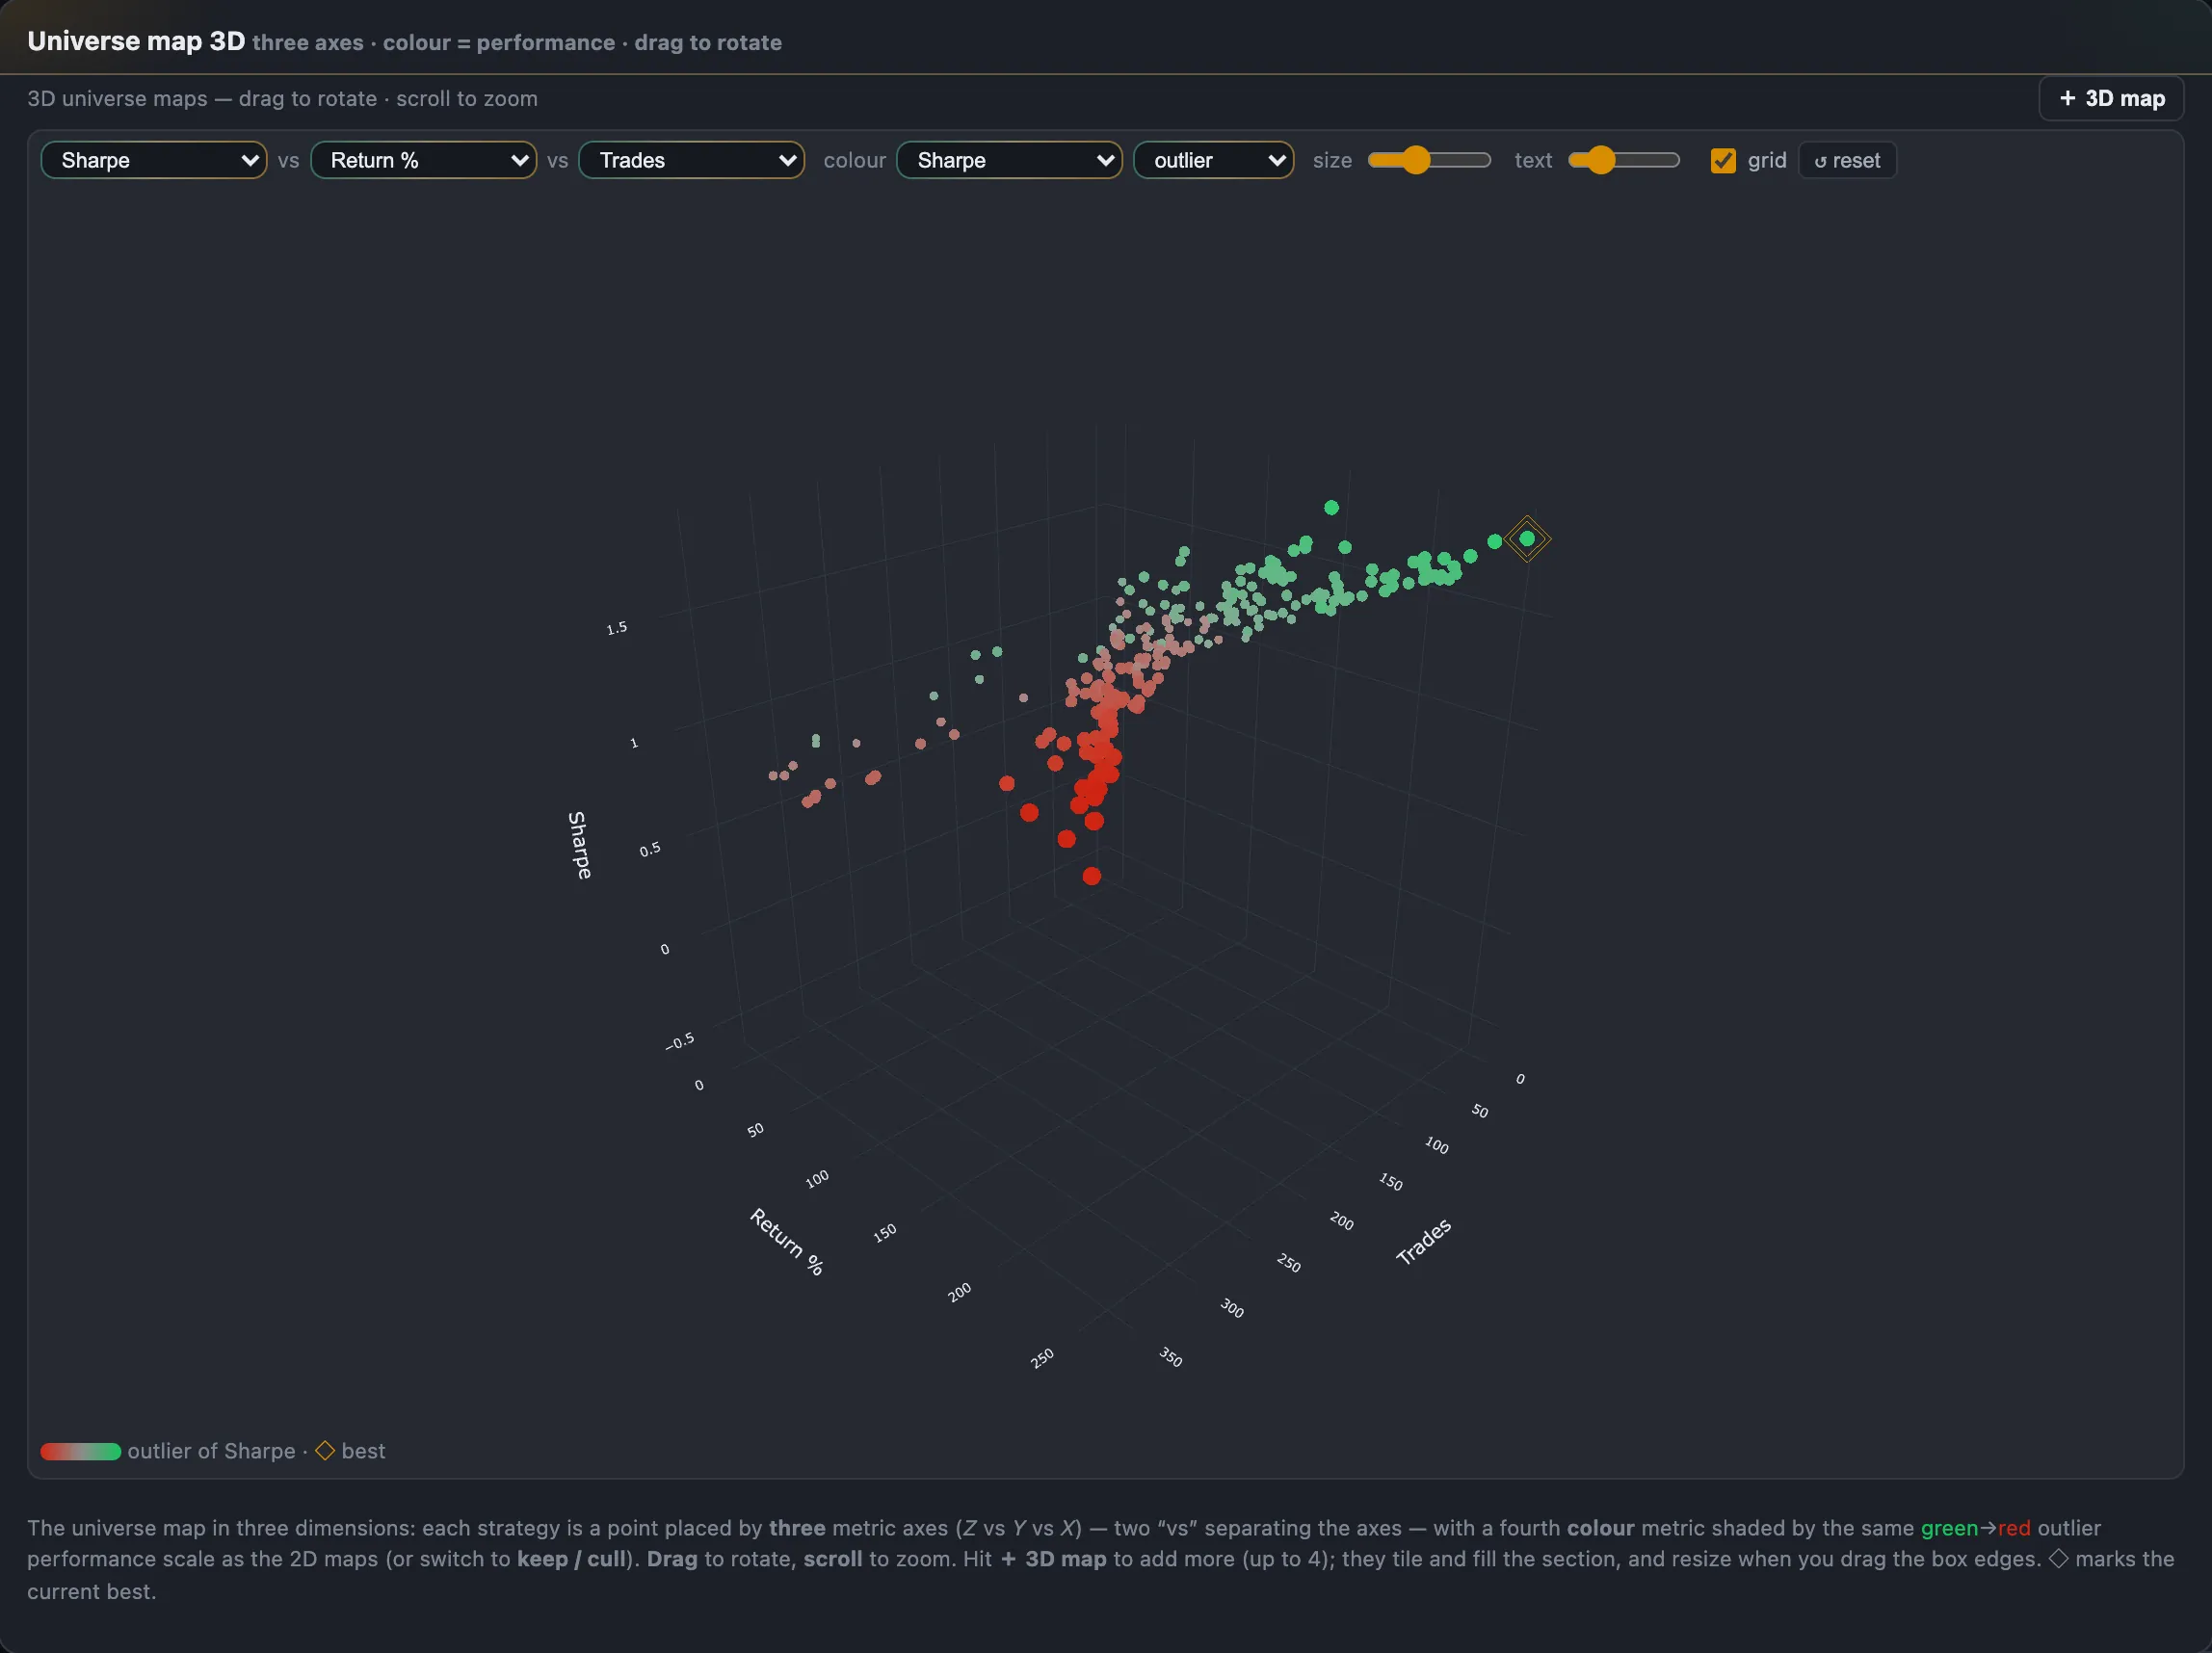
The mining page is laid out in the order a question is asked of a search: what was searched for, what every candidate did, and then one candidate in detail. Every candidate's curve is drawn as a field — on the tape it was mined on and on each basket tape it was only scored on — so a population that works only where it was bred separates from its basket at a glance. Pick one and it is re-run at full resolution into the same book the Backtest page uses, with a line that says whether the re-run reproduced the row it came from.

The countermeasures
Diversity control
A search ranked purely on score converges on one idea wearing a thousand hats. Niche caps limit how many similar candidates survive, and a correlation cull removes those whose returns move together — structural difference is not the same as behavioural difference.
Ranked frontiers
Parents are selected along a Pareto frontier across several objectives rather than by one blended number. Blending into a single score lets a strategy buy a great return with terrible robustness and still look good.
Held-out data, in the loop
The fitness a candidate is bred on is computed on training data only, with an embargo between the training window and the held-out one so a result cannot leak across the boundary through overlapping indicator windows. Parents are ranked on the training span alone, and the holdout itself can rotate, so no single slice of history does all the judging.
The market question, per block
Every candidate is measured against simply holding the tape — in six-month calendar blocks, not as one total that a single good year can carry. A tape too short for two blocks gets no verdict rather than a flattering one.
A seed check
The same search can be re-mined under a different seed. A search whose top candidates mostly fail to reappear was describing its seed, not the tape.
Complexity has a price
More conditions can always fit more noise, so complexity can be charged against fitness — and a verb takes conditions away one at a time to see which were doing any work.
Minimum evidence
A candidate with too few trades is not a strategy, it is a coincidence with a chart. Minimum trade counts ride on every run rather than being applied afterwards.
Cost stress, in the loop
Costs can be varied during the search rather than checked at the end, so fragility to assumptions is selected against instead of discovered later. The cost-stressed twin is derived arithmetically from the candidate's own run rather than re-run, which made honest searching markedly cheaper per candidate.
The empirical null
The same search run against deliberately meaningless data establishes what a good score looks like when there is nothing to find. Anything that does not clear its own null is noise with a nice chart.
It is matched to the kind of search that produced the candidate: a null generated by random draws says nothing about a population that was evolved, so the null mirrors the wave's own steps. And it runs when a cycle arms — before the first cut rather than after — so the bar is set before anything has been selected against it. Its twin tapes wear each bar's own geometry, so a fill cannot see the bar it is about to be judged on.
What the search is allowed to steer on
A search optimises whatever number it is given, exactly and relentlessly, which makes the choice of that number the most consequential setting in the whole apparatus. Three constraints sit on it:
- It is measured where the search cannot see. Cutting on the in-sample score is not available at any setting, and a floor can be put under the statistic as well as a rank — ranking alone keeps the least bad candidates rather than good ones, which is a different thing entirely.
- It can be several numbers at once. The front keeps what nothing else beats on every objective simultaneously, rather than collapsing risk and return into one score using an exchange rate nobody chose. That costs something measurable — about a third of the validation return for roughly half the drawdown — which is why it is a choice and not a default.
- It is the number the product can actually deliver. Fills are the next session's open, not the close the signal was computed from. The gap between those two is the size of the apparent edge in a great many mined strategies.
A search can also be told to lean toward the kinds of set-up that have produced survivors before, weighted by evidence rather than by the last result. Every part of that is off unless you arm it, and each lean names itself in the run's own log — a search that quietly changes its aim between runs produces results that cannot be compared with each other.
Signal quality, at the moment of mining
A candidate arrives with statistics about its own conditions, not just its curve: how often each clause fired, whether any never fired at all, and whether a condition that looks important changes the result when it is removed. A clause that never fires is something the cut can now see — and the rate of dead clauses turned out to track how many conditions a candidate carries, which is exactly the complexity a search is prone to reward.
Two further measures — how much each condition adds on its own, and how much two conditions say the same thing — were built, measured, and kept report-only. The measurement showed the sign of the first flipping inside its own standard error, and a filter built on a number that noisy would select on luck while looking rigorous. The report stays; the gate was withheld.
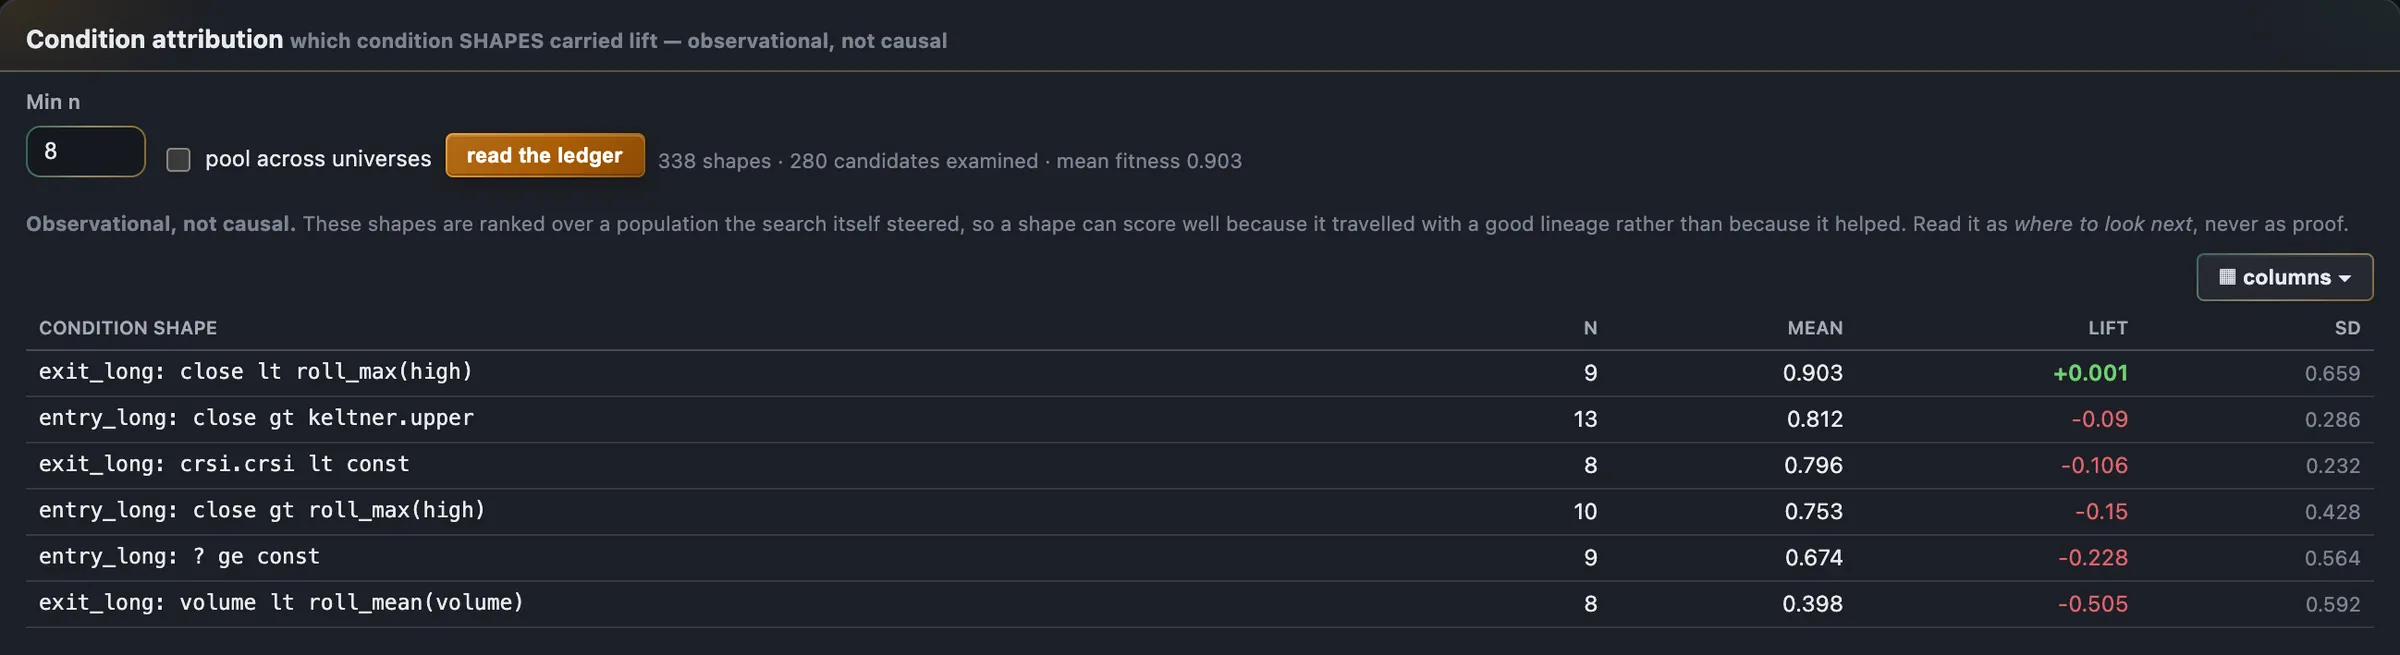
Condition attribution
When a search returns something, the natural question is which part of it is doing the work. The attribution ledger records, per condition, how often it fired and what happened when it did — so a candidate whose entire result rests on one lucky gate is visible as such rather than presented as a coherent idea.
Why it is fast enough to be useful
- A worker pool that imports almost nothing. Evaluation runs in separate processes whose import surface is deliberately tiny. A worker that had to load the whole application — web framework, machine learning stack, a large history file — would cost a fraction of a second each, which across a large search is the difference between practical and not.
- Spawned, never forked. The main process is multithreaded and may be holding a live broker session. Forking that is a known way to produce a process in an undefined state.
- Series are memoised per job and handed to candidates shared rather than copied, which means the code path that reads them must stay strictly read-only — a constraint the project treats as load-bearing rather than an implementation detail.
Universes
A finished search is saved as a universe: the full logic trees, the statistics, the run configuration that produced it and the seed that reproduces it. Universes can be filtered, re-scored, compared and mined further. The point is that a result is stored with enough context to be interrogated months later, rather than as a row in a leaderboard.
A universe stores both halves of the run that made it — the search and the selection. Re-opening one restores the cut, the keep filters, the gates and the stop rules exactly as they were armed, because "what did I search for" and "what did I keep" are two different questions and a stored answer to only the first is not reproducible. There is a roster across all of them, with the linking, renaming, pruning and deletion that a few hundred saved searches eventually require — and a delete that refuses while anything still refers to what you are removing.
A cycle of all this can be handed to an unattended researcher, which is its own page — mostly because the interesting part is not the searching but the list of things such a researcher is prevented from reaching.
Pricing the exit
One lab sits beside the search rather than inside it, and it is included here because it is the clearest example on the site of a measurement coming back against the thing that was asked for. It was requested as an optimiser: mine the best stop-loss and take-profit rules, apply them, make mined strategies beat the market. The measurement taken before building it found that a stop's effect on return does not survive contact with new data by any method tried — while its effect on drawdown transfers reliably.
So it prices rather than optimises. Every candidate exit is an insurance line: what it costs in return, what it buys in drawdown, how many extra trades it causes, and whether it ever actually fired. The recommended pick is a constrained one — cheapest protection meeting the requirement you set — and below a floor on how many times a stop was genuinely tested it declines to pick at all.


The Adversary — distance to death
The last question the lab asks of a survivor is not "how good is it" but "what kills it". The Adversary runs a candidate through a fixed ladder of eleven increasingly hostile synthetic futures — calibrated calm, rising volatility multiples, bears, jump storms, a crash world — a few seeded waves per rung, with death declared when a rung's median drawdown breaches the kill floor. Because every rung is stated in calibrated units of the tape's own tail volatility, the verdict reads as a sentence: the mildest world that kills this one is a bear at 1.6× volatility.
- The ladder is fixed, so verdicts compare. Two candidates run the same eleven worlds in the same order; "survived to rung seven" means the same thing about both.
- Nothing is stored. The hostile worlds are generated in memory and discarded; what remains is the stamp on the row — rungs survived, and the worst drawdown seen.
- It refuses a synthetic base. The hostile futures are grown from a real tape's own character, so the demonstration run uses the neutral demo series rather than a SYN-* one — the same rule the stress lab and the Ordeal apply.
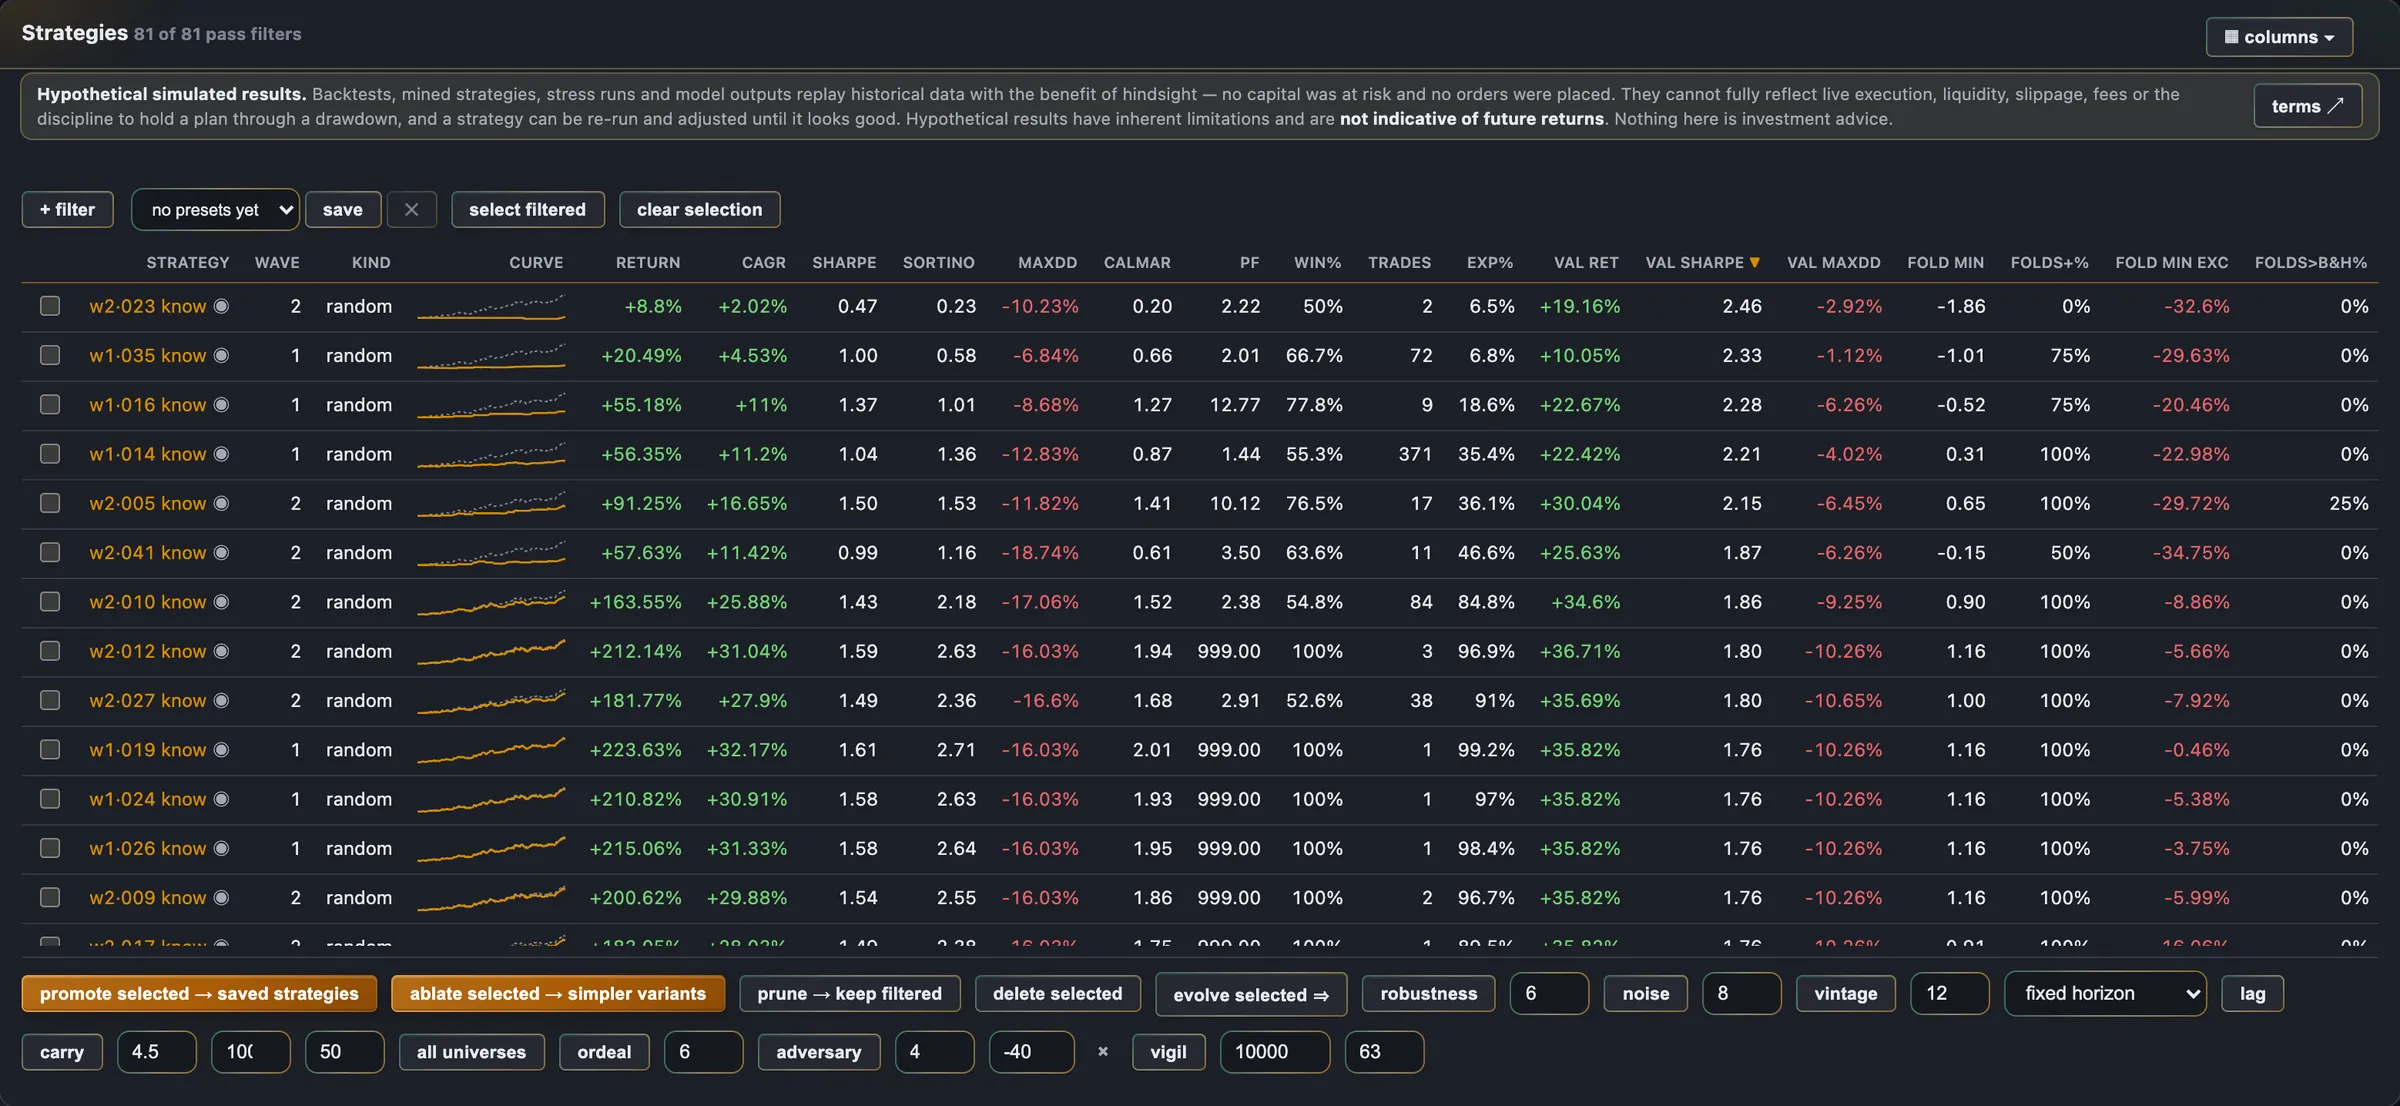
Nothing on this page is investment advice or a performance claim. The figures inside the frames are a demonstration search's own arithmetic over app-generated synthetic series — illustrations of the tools, not results, behind the application's standing hypothetical-results warning. A search result describes history under assumptions you supplied; it is not a forecast. Trading involves risk of loss.
Stage four
Trying to break it
The part of the project with the most work in it, because it is the part that decides whether anything else means anything.
Everything here is adversarial by design. The question is never "does this look good" — it is "what would have to be true for this to be an illusion, and can I make that visible?"
Out of sample, and the embargo
Testing is separated from the data used to find the idea. That much is standard. The part that is easy to get wrong is the seam: an indicator with a 200-bar window evaluated on the first day of the held-out period is partly computed from training data. An embargo between the two windows keeps the boundary honest, and it applies inside the search loop rather than only in a final report.
Walk-forward
Rather than one split, the strategy is repeatedly fitted on a window and tested on the window that follows, marching through history. This answers a different question from a single hold-out: not "did it work on data I did not look at" but "would it have kept working, re-derived as you went, all the way along?"
The gauntlet
A structured battery that re-runs a surviving strategy under changed conditions — different windows, different instruments, degraded assumptions — and reports coverage alongside the score.
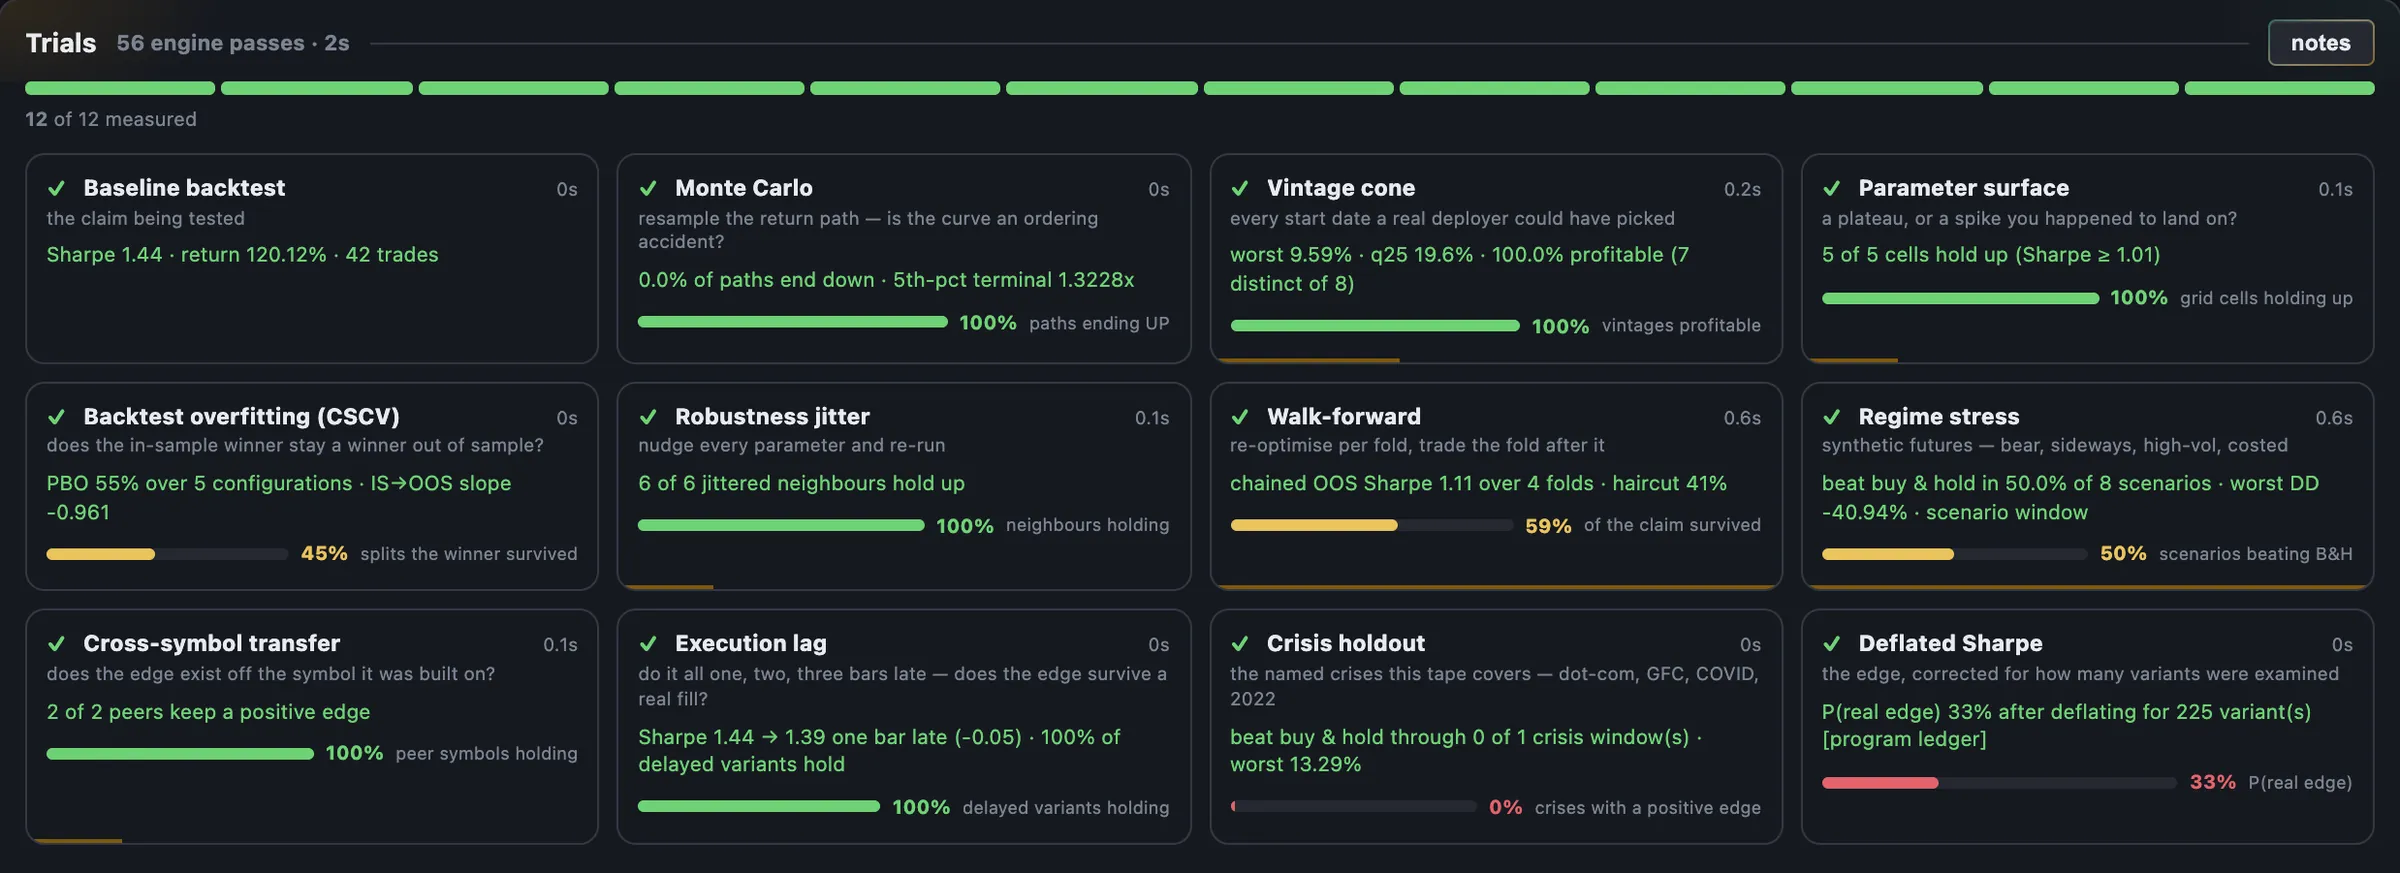
The Ordeal, as one page
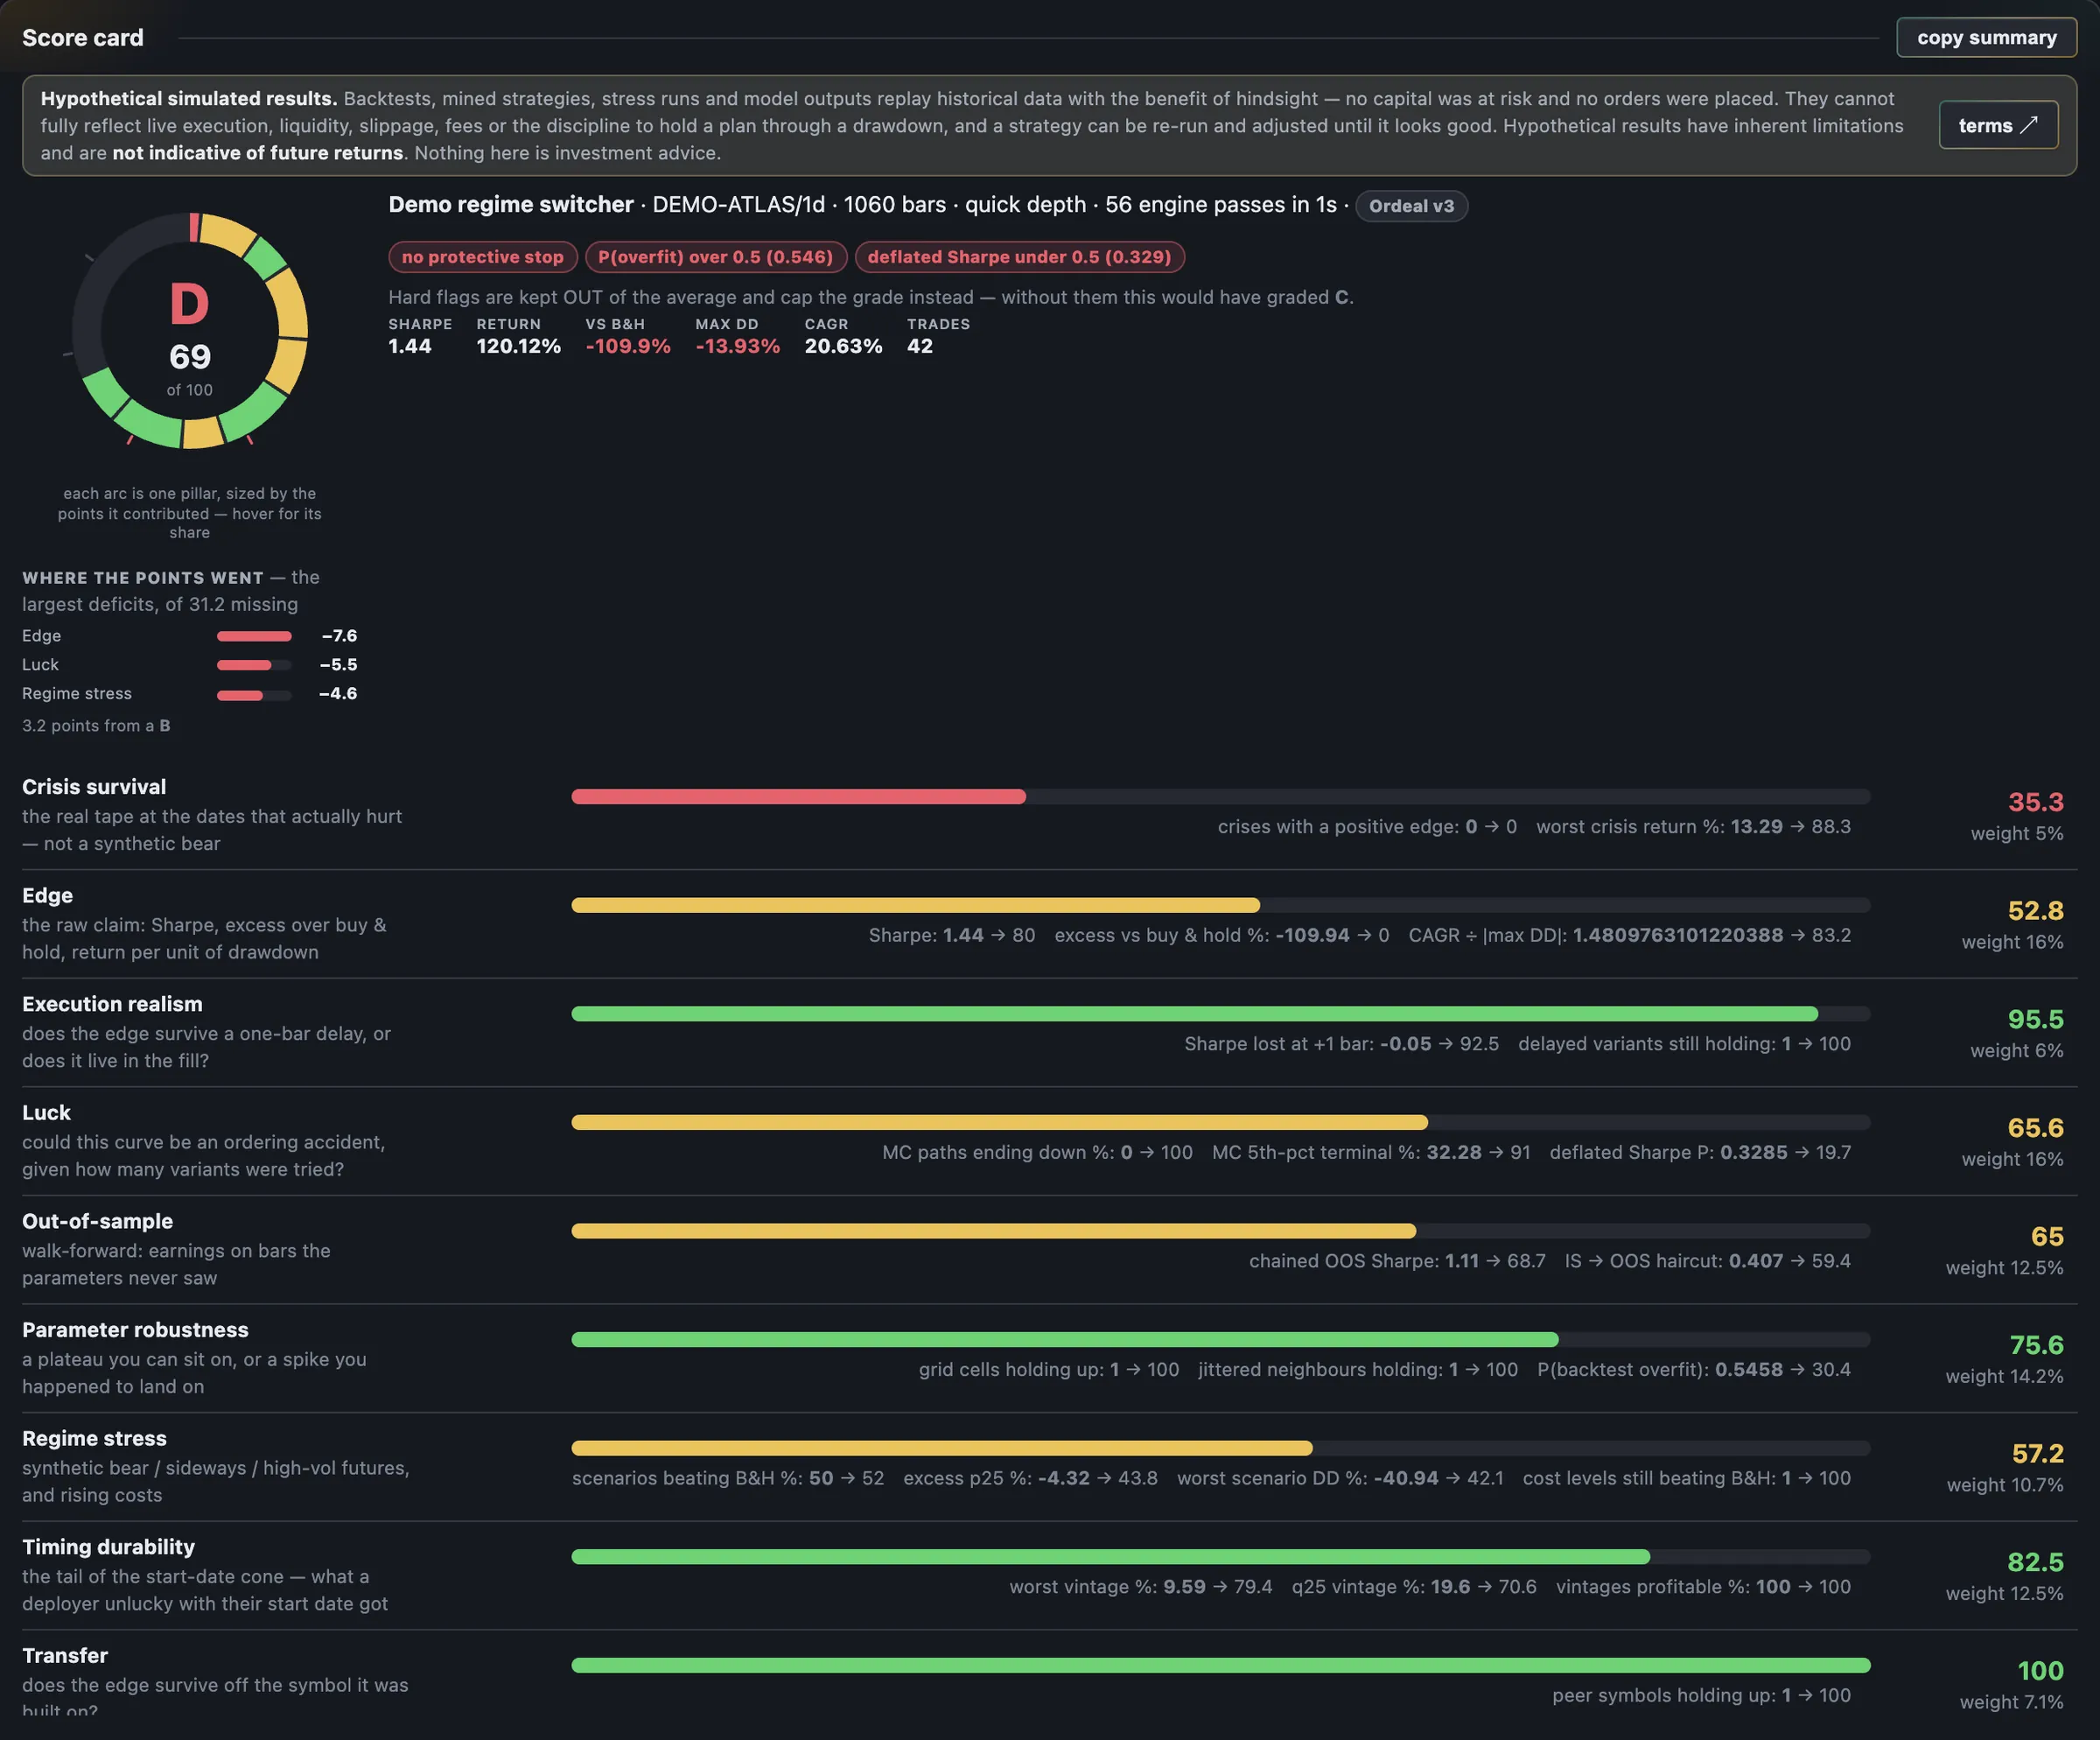
Twelve trials run in sequence against one strategy with nothing to configure beyond depth — the same ordeal every time, which is the point. The result is drawn as one page: each trial a card with a meter, every meter oriented so that more is better (the server inverts the ones that are naturally "lower is better"), and a score card whose grade ring is stacked by pillar so that the arcs sum to the score exactly.
The letter had to be made to mean something again. An earlier version let hard flags pull the average down, and across a real population of mined strategies the letter had drifted into little more than a count of flags. Version three keeps every flag out of the average and lets each one cap the grade instead — and prints what the grade would have been without them.
Stress sweeps
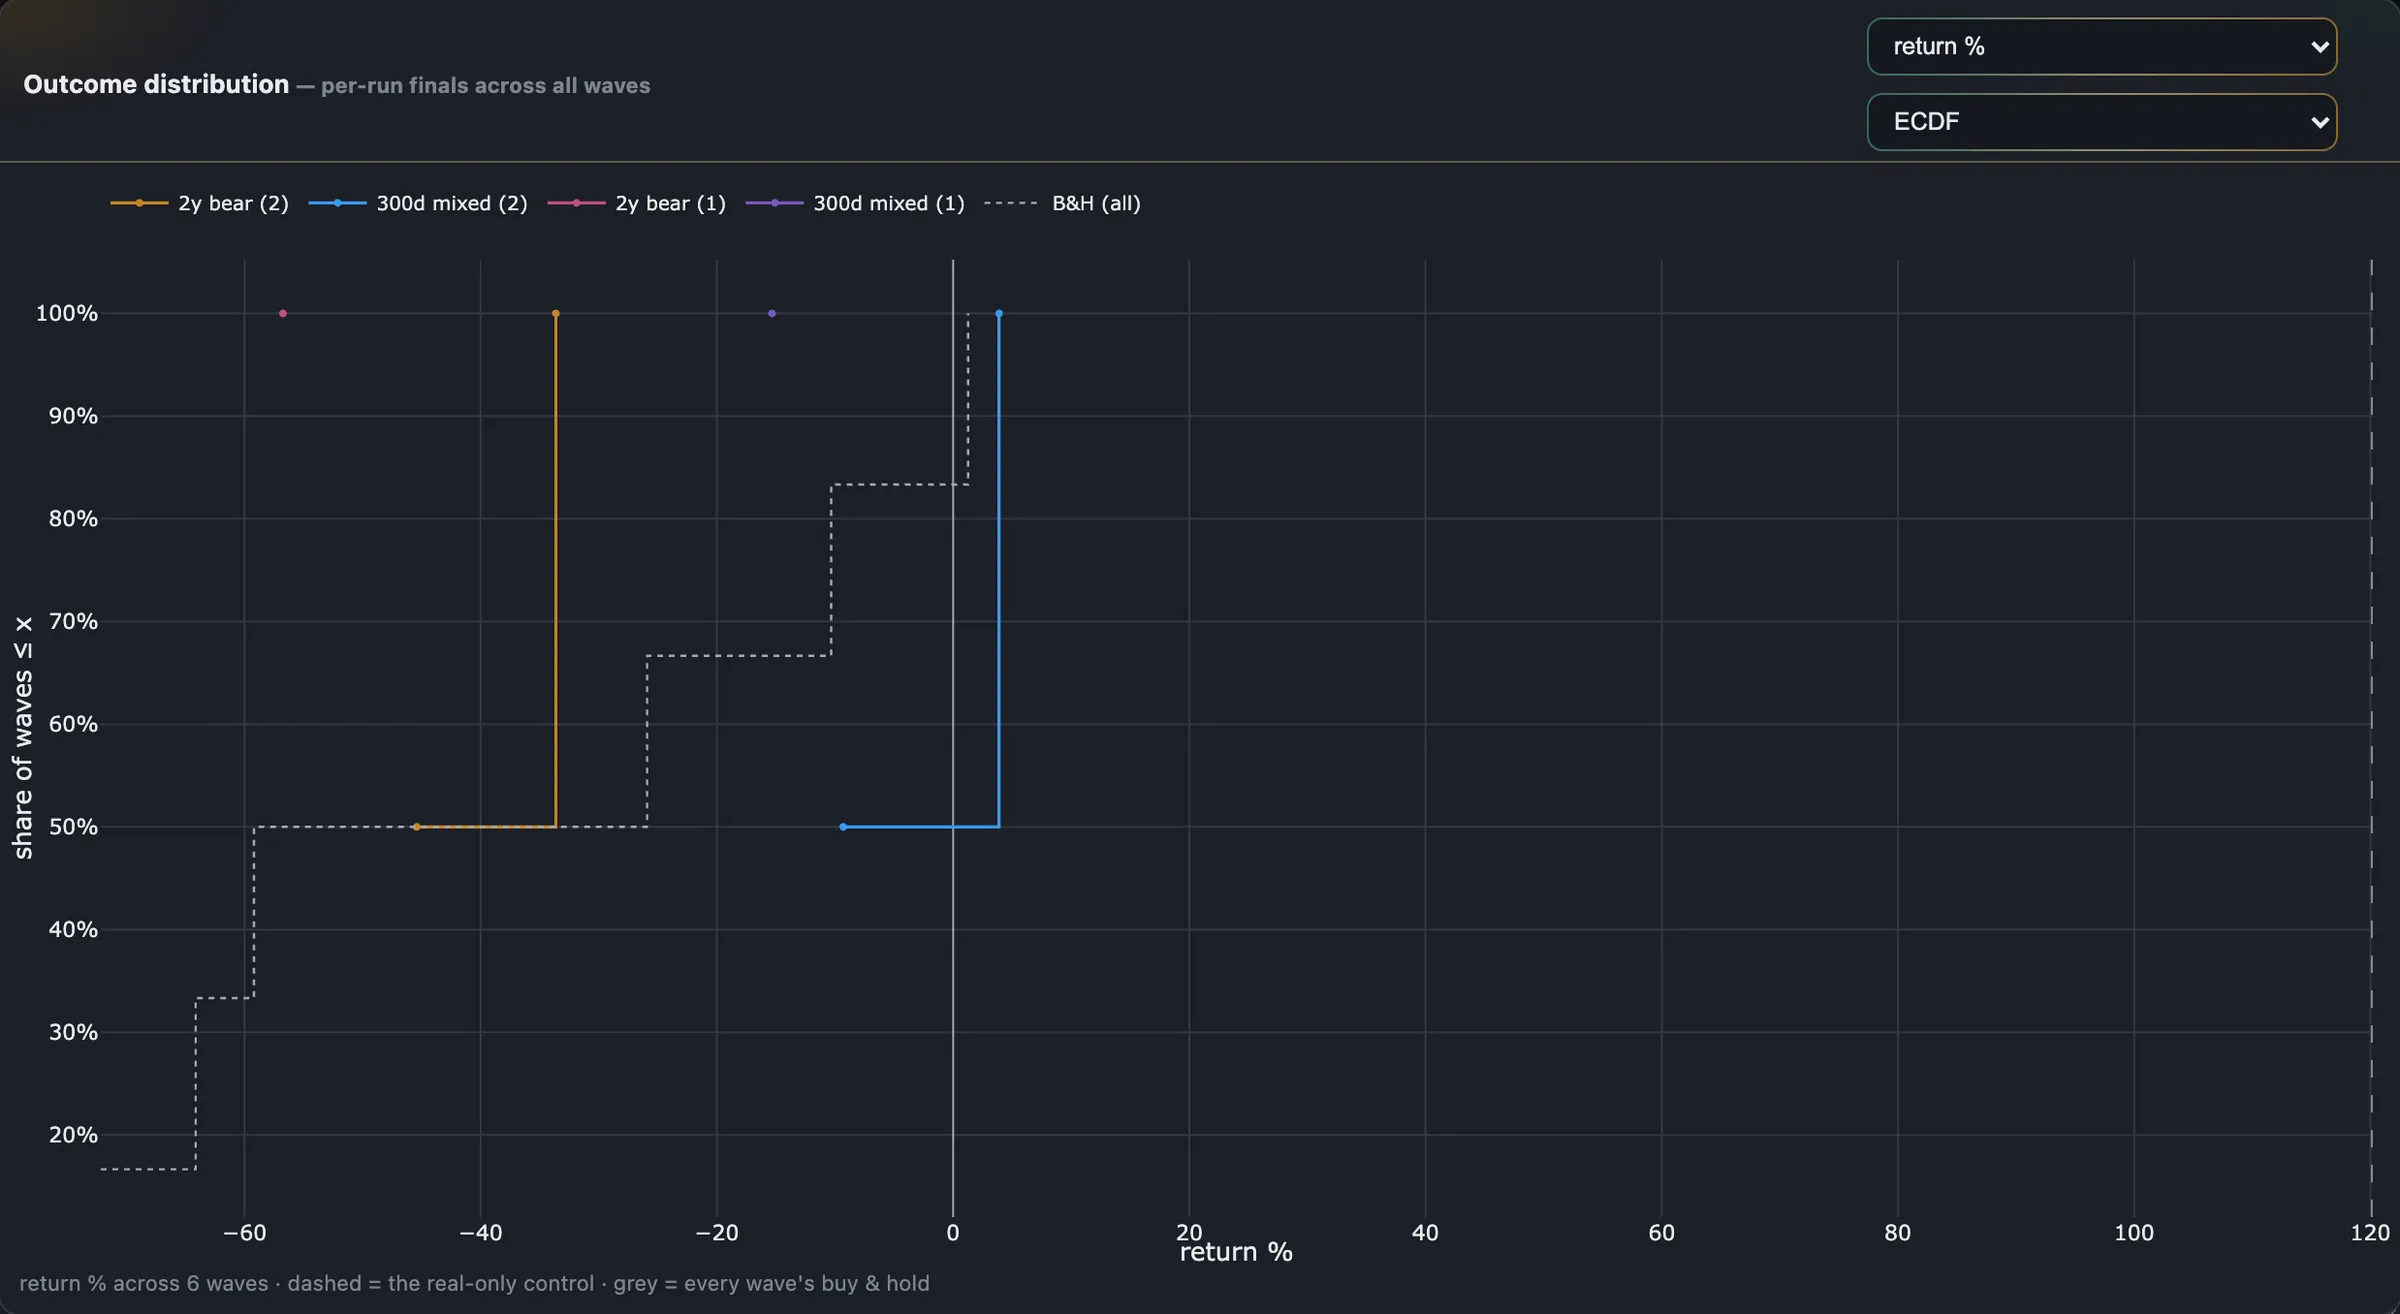
Costs, slippage, execution delay, volatility shocks and price jumps swept across ranges rather than spot-checked at one value. The whole sweep is saved, so the grading can be revisited later against different thresholds without re-running anything.
- Cost and slippage ranges — at what assumption does the edge disappear?
- Execution delay — how much does it matter that you cannot fill instantly?
- Volatility shocks — behaviour when the regime changes underneath it.
- Price jumps — gaps and discontinuities, which stops do not protect against as well as people assume.


Three more questions the battery asks
A tail nobody looked at — the sealed windowproof
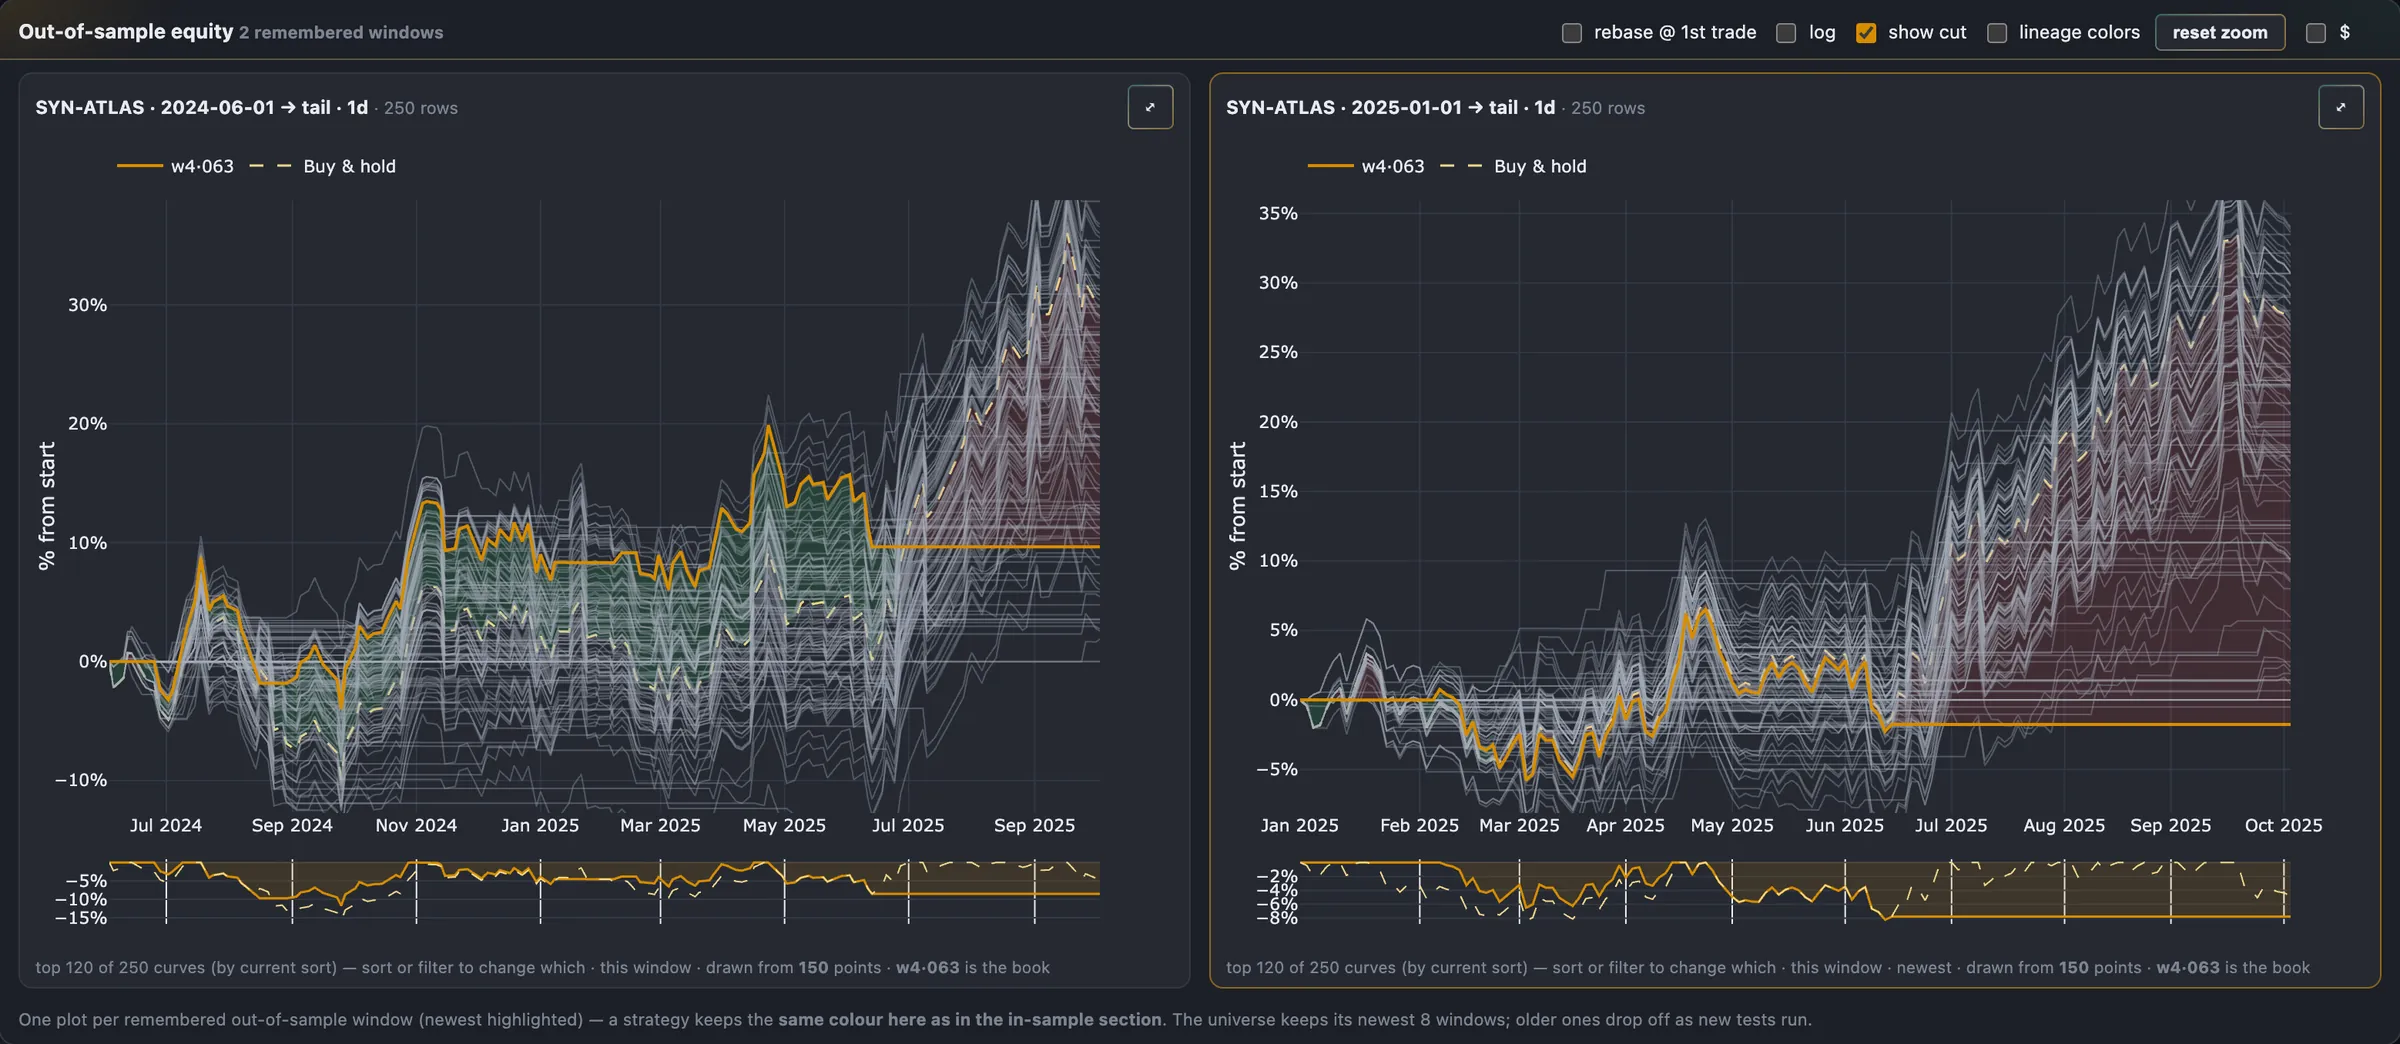
Every number an unattended search produces has been selected on: fitted on the training span, selected on the validation slice, selected on again at the out-of-sample tail. So the last months of the tape are sealed before the search begins — no pass, no gate and no Ordeal may read them — and opened exactly once, after the search is over. It is the one number the selection cannot have touched.
Guards against: an out-of-sample test that has quietly become in-sample through being looked at a hundred times.
The market question, per regimemarket
Beating buy-and-hold over a whole tape can be one good regime carrying two bad ones. The comparison is also made regime by regime, in blocks, so a strategy that only works when the market is rising is identified as a leveraged opinion about the market rather than an edge.
The noise floor decidesnull
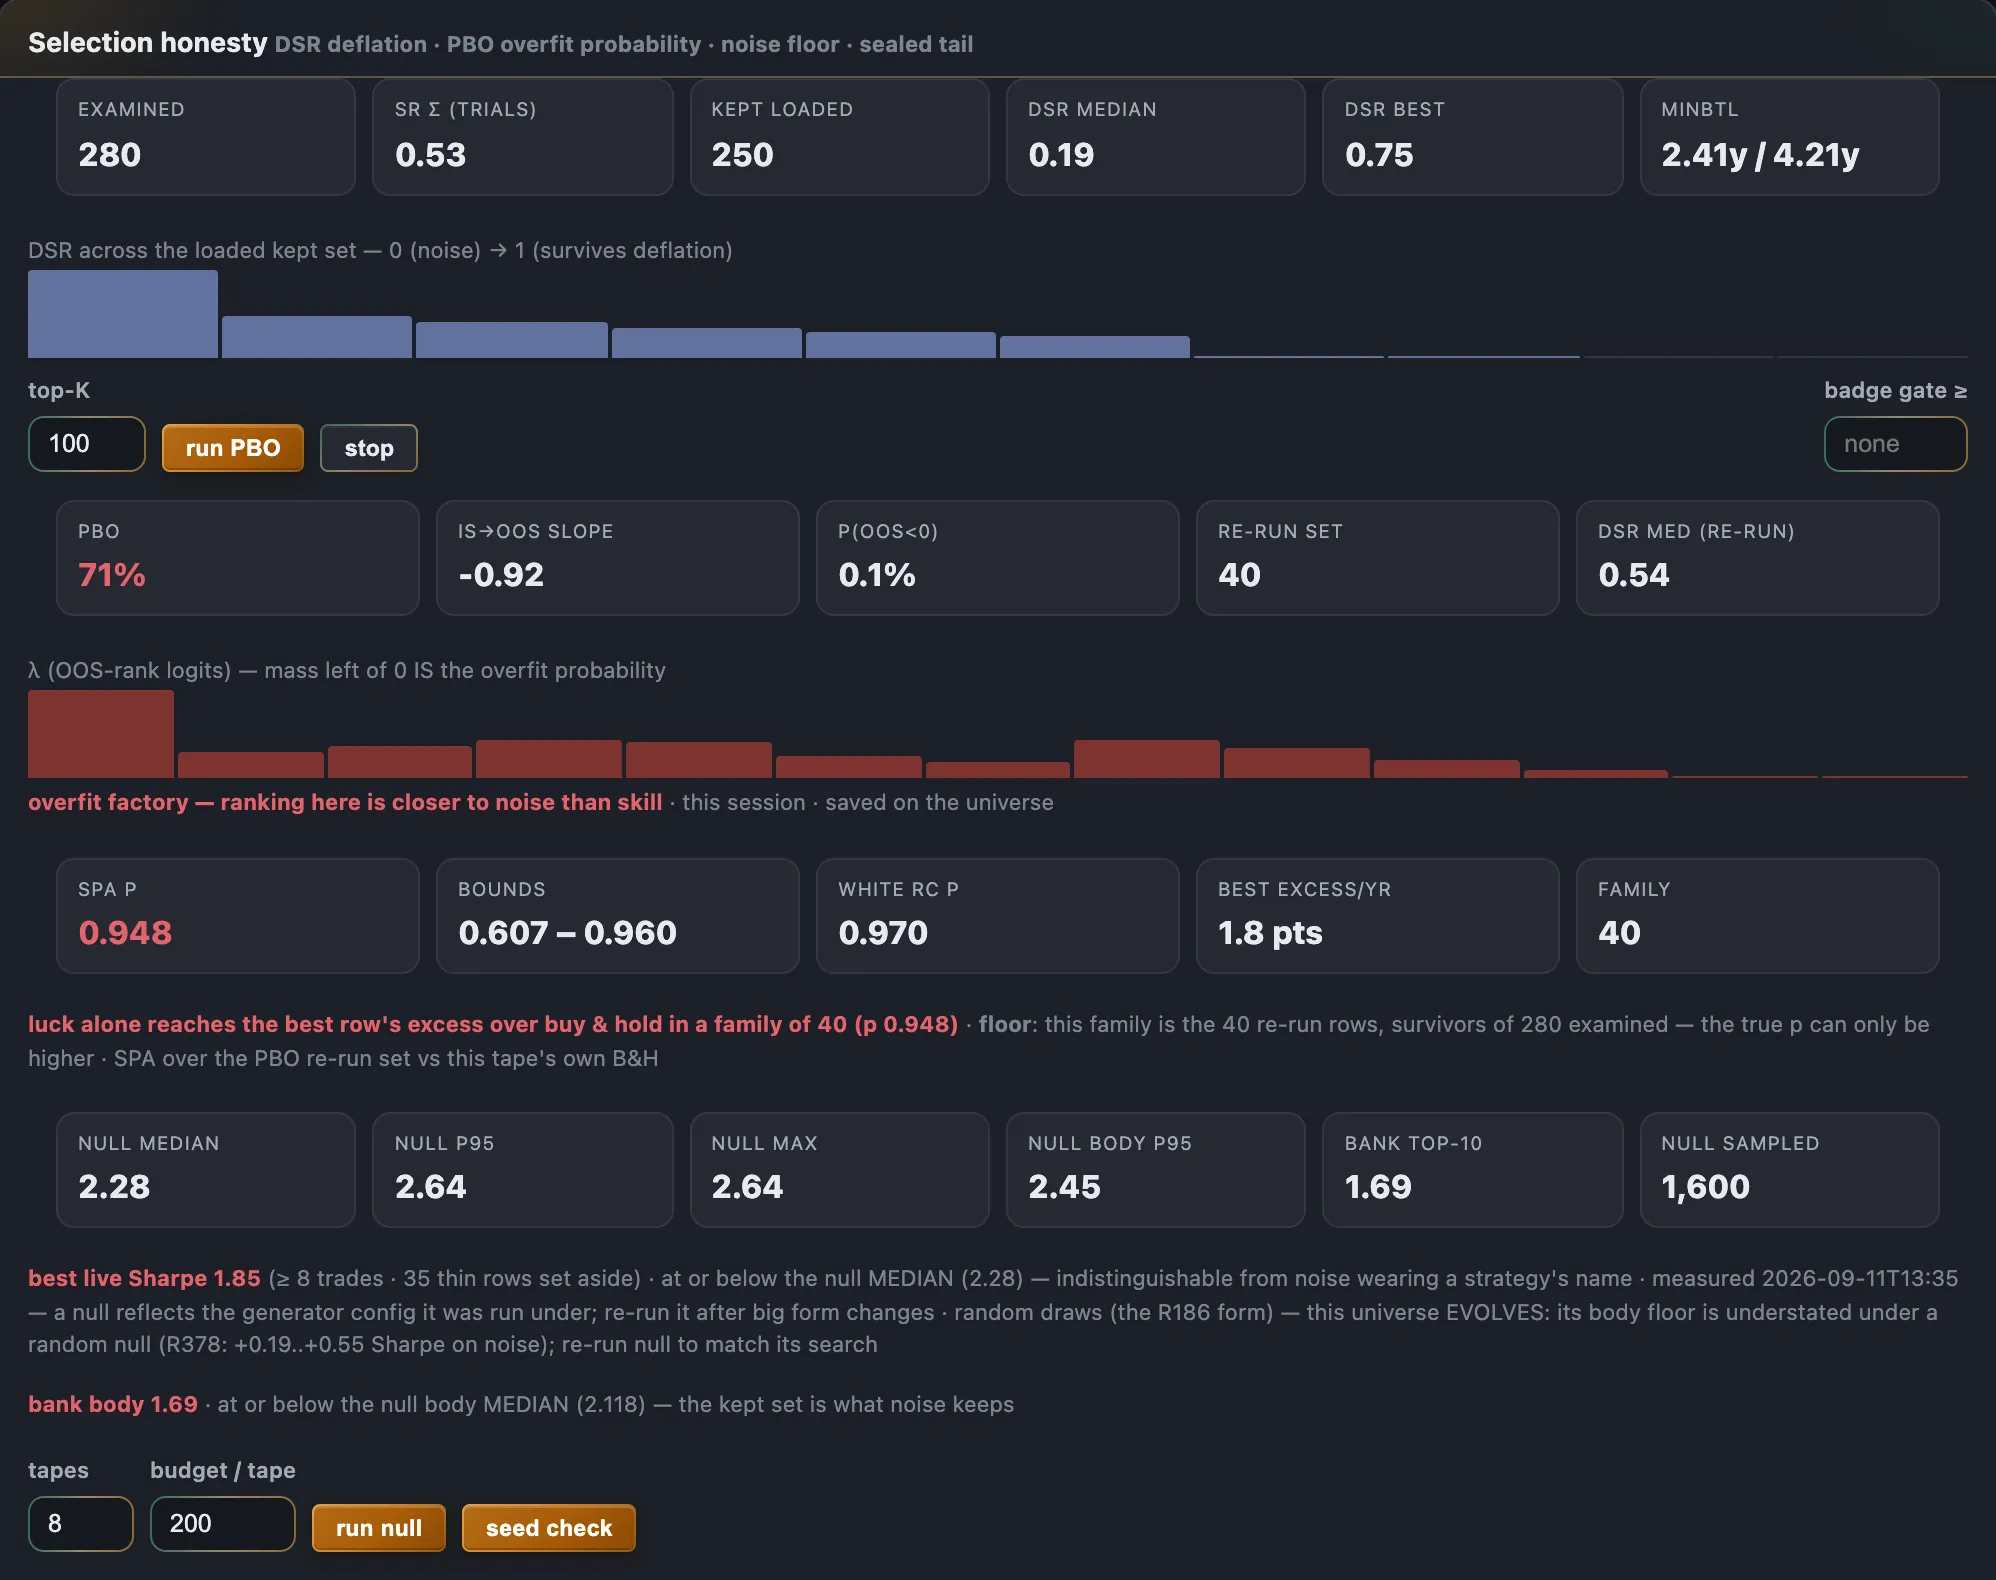
A search's results are read against the same search run on tapes with the signal destroyed — and the floor is compared with the body of the results, the top few together, rather than the single best row, because the best of many draws is exactly what luck is best at producing.
Synthetic continuations
Price paths generated beyond the end of real history, with the statistical character of the real series but none of its specific sequence. A strategy tested on these is being tested on data it provably cannot have been fitted to, because the data did not exist when the strategy was found.
Synthetic results are held in memory and never written into the stored history as though they were real. A synthetic run is evidence about robustness; it is not a track record, and the two must not be able to be confused later.
Vintages
A strategy can be re-run anchored at different start dates to see how much of its result depends on when you happened to begin. This is distinct from slicing an existing curve — slicing shows you a segment of one run, re-running produces a different run, and the difference between those two is exactly the effect being measured.
Scenario windows
Behaviour isolated to specific historical periods — a crash, a squeeze, a long grind — computed server-side on the full-resolution equity rather than on a sampled curve, because the statistics of a drawdown are not preserved by sampling.
The Adversary — the mildest world that kills it
Every test above asks whether a strategy survives something. This one asks how little has to change before it does not, which is a more useful question and a harder one to answer honestly. Eleven worlds run in order from calm to crash, each stated in units calibrated against the strategy's own measured behaviour rather than in absolute numbers somebody chose.
The noise retest
Every bar is nudged by a draw scaled to its own trading range — quiet days wobble less than violent ones — and the strategy runs again. The closing prices are deliberately not re-chained, so this is a wobble around the path history actually took rather than a drift into a different history.
It answers a question the neighbouring tests do not. Perturbing the strategy asks whether its parameters sit on a knife-edge; destroying the structure entirely asks what luck scores. This perturbs the tape — and asks whether the result needed prices to land exactly where they did. A stop grazed by a fraction of a percent, an entry that required one particular tick: these are invisible to every other test on this page and fatal in practice.
Testing the procedure, not just the winner
All of the above examine one strategy. The most important source of self-deception is not in any individual strategy, though — it is in the selection that produced it. Search ten thousand candidates and the best one will look excellent whether or not anything is there, and no amount of testing that best one in isolation will reveal it.
So two published statistics are run against the search's own record. The first splits the trial history combinatorially and asks how often the configuration that looked best in one half failed to stay above median in the other — an estimate of the probability that the procedure is overfitting. The second asks whether the best result in the population beats what you would expect from that many attempts at nothing, which is the multiple-comparison correction a per-strategy test cannot make. Both are read as floors, and ties count against the candidate.
A third figure sits beside them and is computed before any searching starts: given the length of history you have pointed at and the number of candidates you are about to request, how good would a purely lucky best be expected to look. A result underneath that line is not a weak result — it is not a result. See the tape's ceiling.
What survives
Very little, and that is the intended outcome. The purpose of this stage is not to certify strategies; it is to make the reasons for doubt explicit and quantified, so that whatever you do decide to run, you are doing it knowing which assumptions it depends on and how hard each one was pushed.
Surviving these tests is not evidence that a strategy will work. Robustness testing can reduce the chance you are fooling yourself; it cannot establish that a pattern will persist. Nothing on this page is investment advice or a performance claim; the figures and verdicts inside the frames are a demonstration instance's own arithmetic over app-generated synthetic series — including the failing grades, which is the tooling doing its job — and trading involves risk of loss.
A personal project. Not advice. Nothing for sale.
This site describes a personal engineering project, written and run by one person in their own time and published under the name Mithraeum Agora. There is no company behind it, no team and no other contributor. It is not a product and not a business. Nothing here is for sale — there is no account to open, nothing to buy, no subscription, no waiting list, and no service is being offered or solicited. Sending a message through the note form creates no customer, client or contractual relationship of any kind. The note form on the contact page is the way to reach me, and it is the only one.
Nothing on this site is investment advice, financial advice, tax advice, or a recommendation, solicitation or offer to buy or sell any security or financial instrument. I am not a financial adviser, a broker, an investment manager or a regulated firm, and nothing here should be relied on as though I were. If you are making decisions about money, take advice from someone qualified and regulated to give it.
Figures do appear on this site, inside screenshots, and none of them is a performance claim. Every one is a demonstration instance's own arithmetic over price series the application generated itself — synthetic data, with no real market behind it — shown to illustrate what the tools display. They are hypothetical and simulated: no capital was at risk, no orders were placed, and a result computed over history with the benefit of hindsight carries limitations that live trading does not forgive. Hypothetical results are not indicative of future returns, and past performance — real or simulated — predicts nothing.
No brokerage, market-data vendor or other company is named anywhere on this site, and where a name appeared inside a screenshot it has been redacted out of the image. Nothing here states or implies that any company is associated with this project, endorses it, sponsors it, supplies it or has reviewed it. None is, and none has.
What this site collects. Nothing, unless you write to me. There is no analytics, no tracking, no advertising, and nothing at all is loaded from another domain. If you use the note form it takes the name, address and message you type, stores them privately where only I can read them, and keeps them for up to a year before they are deleted — sooner if you ask, and you do not have to give a reason. Your IP address is not kept. One thing is stored on your own device: the colour theme you pick, remembered by your browser so the site does not change appearance every time you arrive. It is written only when you choose a theme, and it identifies nothing and nobody. The preference itself never leaves your browser, but the screenshots follow it, so the pictures your browser fetches from this site are the ones drawn in that palette. The contact page answers all of this in more detail.
Terms of use. This site is provided as is and as available, with no warranty of any kind, express or implied. It describes software under active development: anything here may be incomplete, out of date or simply wrong, and it may change or disappear without notice. Nothing on it is a contract, a term of service for any product, or a promise that anything described will be built, released or kept running. To the fullest extent the law allows, I accept no liability for any loss or damage arising from use of this site or from reliance on anything it says. Nothing here excludes or limits any liability that cannot lawfully be excluded or limited.
Trading involves risk of loss.